10. Overall Impacts#
This chapter summarizes statewide differences between EMFAC2025 and EMFAC2021 for vehicle activity and emissions. It highlights how key model updates, revised activity assumptions, and regulatory changes shape projected trends through 2050, with additional context for light-duty and medium-/heavy-duty fleets where the effects differ.
As described throughout this document, EMFAC2025 retains several EMFAC2021 updates but also introduces new features and major updates. Noteworthy updates to EMFAC2025 include:
Estimation of emissions and activity of light-duty vehicles aged 45 years and older (Section 2.1).
Updated light-duty activity to reflect driving speeds and VMT that are more representative of real-world driving on California roads (Section 2.2.2).
New high-speed light-duty speed correction factors to account for emissions at speeds above 70 mph (Section 2.2.3).
Comprehensive updates to light-duty and heavy-duty emission factors (Section 5 and Section 6).
Incorporation of a range of new regulations including the Clean Truck Check, the Advanced Clean Fleets, and the Clean Trucks Plan:
Clean Truck Check (CTC) (Section 9.1) is a comprehensive heavy-duty vehicle inspection and maintenance (HD I/M) program that ensures emissions control systems function properly when traveling on California’s roadways. Implementation began in 2023. This regulation applies to heavy-duty trucks with GVWR > 14,000 lbs.
Advanced Clean Fleets (ACF) (Section 9.2) requires state and local government fleets to purchase 50% ZEVs from 2024 to 2026 and 100% ZEVs starting in 2027.
Federal Clean Trucks Plan (Section 9.3) sets stricter pollution emission standards for federally certified heavy-duty engines greater than 10,000 lbs., starting with engine model year 2027. Because the vast majority (over 95%) of vehicles below GVWR of 14,000 lbs. are chassis-certified, staff assumed this regulation only applies to vehicles with GVWR > 14,000 lbs.
This chapter presents comparisons between emissions and activity estimates from EMFAC2021 and those estimated using EMFAC2025 at the statewide level. In addition, the comparisons include EMFAC2021 estimates adjusted for the removal of emissions benefits from the Advanced Clean Trucks (ACT), Zero-Emission Airport Shuttle, Heavy-Duty Vehicle and Engine Emission Warranty and Maintenance Provisions (Warranty Phase 1), and Heavy-Duty Omnibus (Omnibus) regulations. These initiatives were affected by congressional resolutions that purported to disapprove of U.S. EPA decisions to grant California waivers (CARB, 2025). The adjusted EMFAC2021 estimates are referred to as “EMFAC2021 with adjustment factors” in this chapter. These adjustments provide insight into the impacts of the federal actions on EMFAC2021 projections and help isolate the effects of EMFAC2025 updates from regulatory changes.
To better illustrate the differences, comparisons for light-duty (GVWR below 8,500 lbs., including motorcycles) and medium-duty/heavy-duty (GVWR 8,501–14,000 lbs./GVWR above 14,000 lbs.) vehicles are presented alongside overall comparisons. The EMFAC results in this chapter use EMFAC’s default VMT data. Note that CARB’s SIP inventory uses VMT and speed profiles from Metropolitan Planning Organizations (MPO), which differ from EMFAC’s default VMT.
10.1. Vehicle Population#
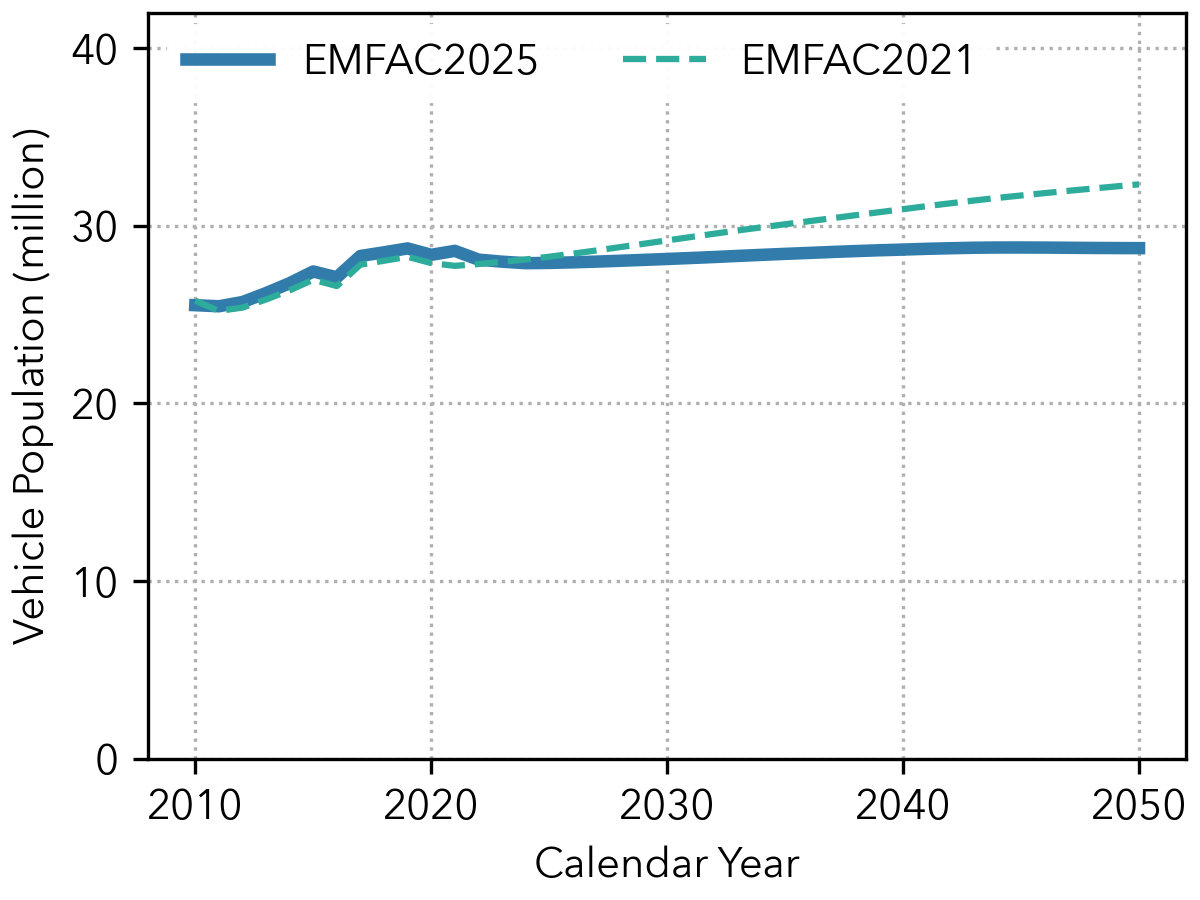
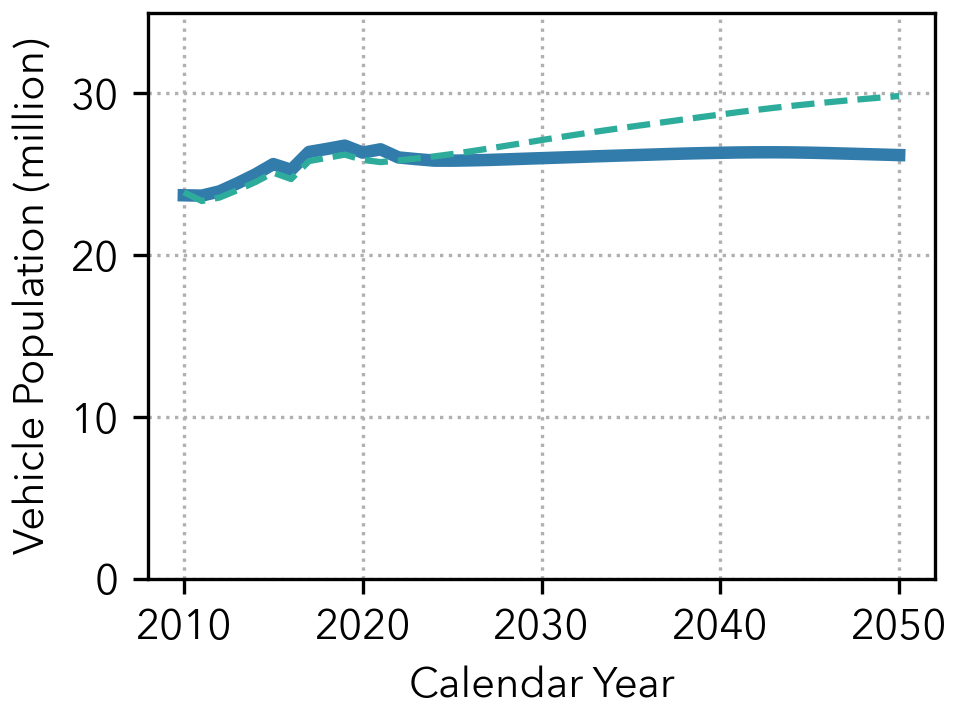
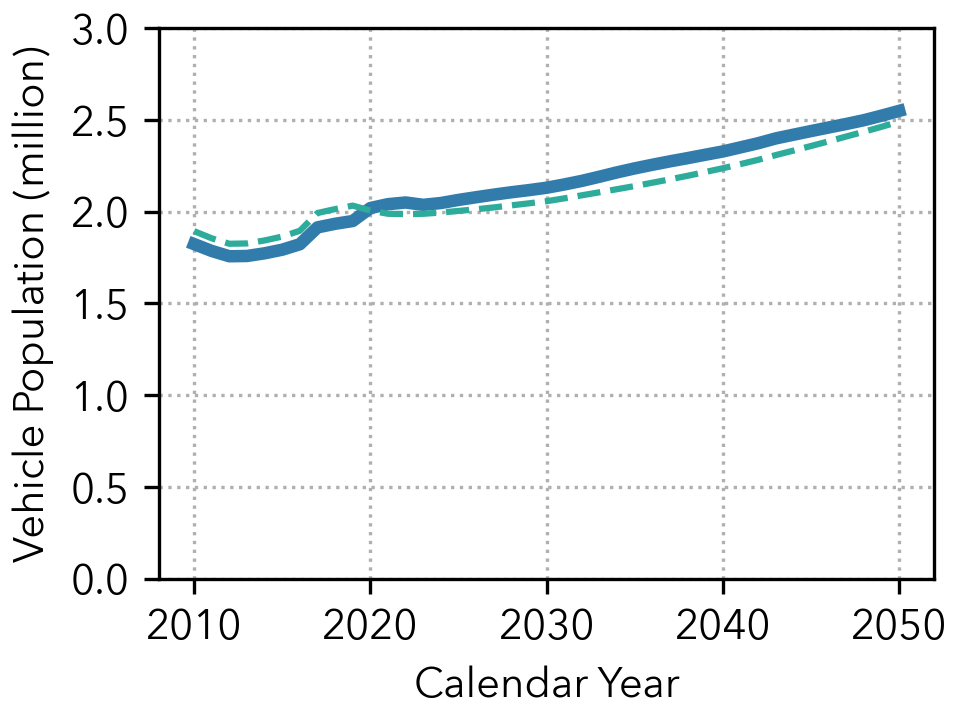
Figure 10.1 compares total vehicle populations of EMFAC2025 and EMFAC2021. EMFAC2025 projects about 3.6 million fewer total vehicles than EMFAC2021 by 2050. The light-duty population decline is largely attributable to decreased human population and slower economic growth projections in California.
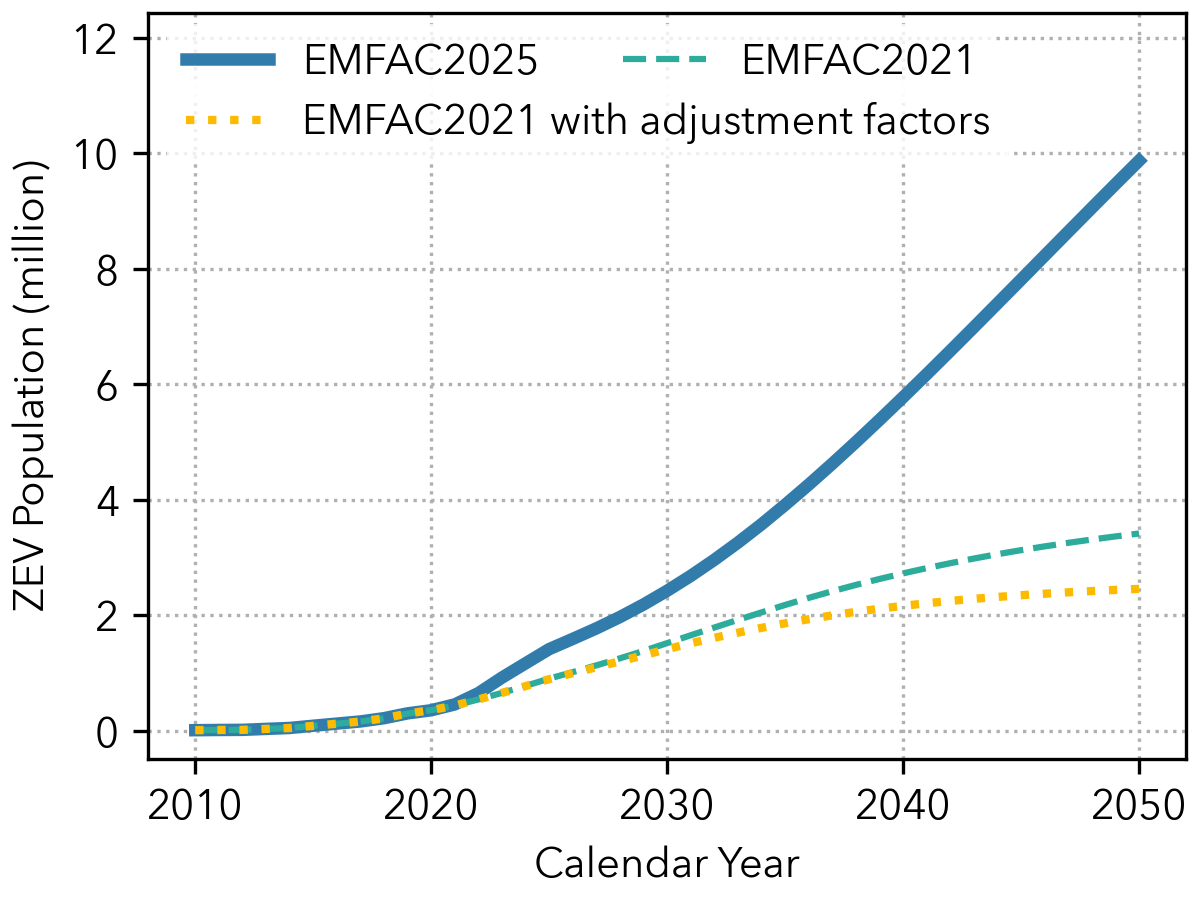
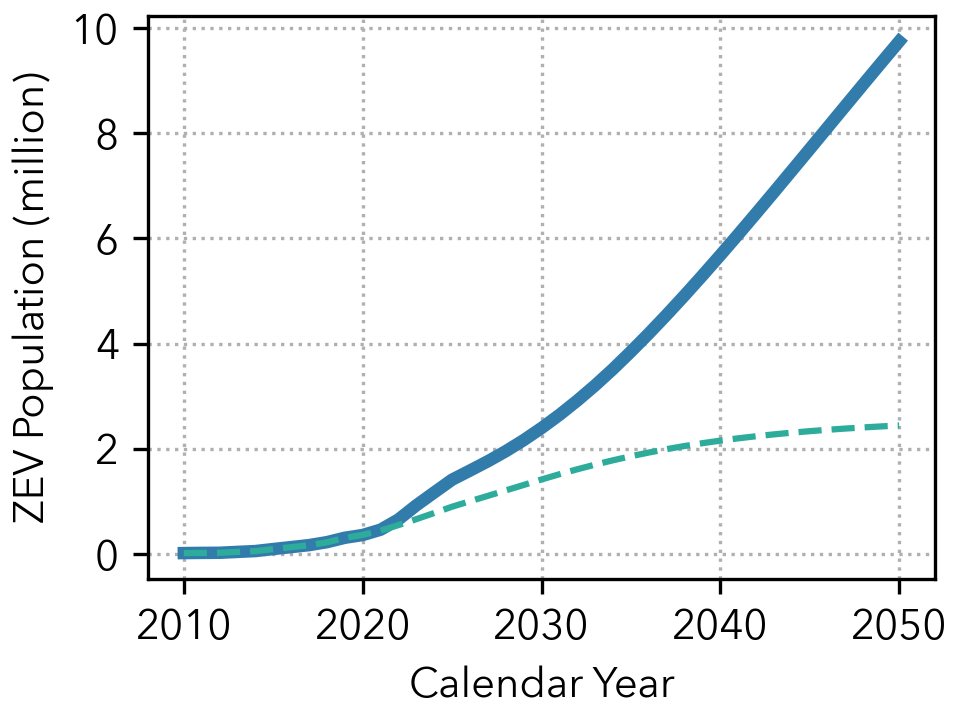
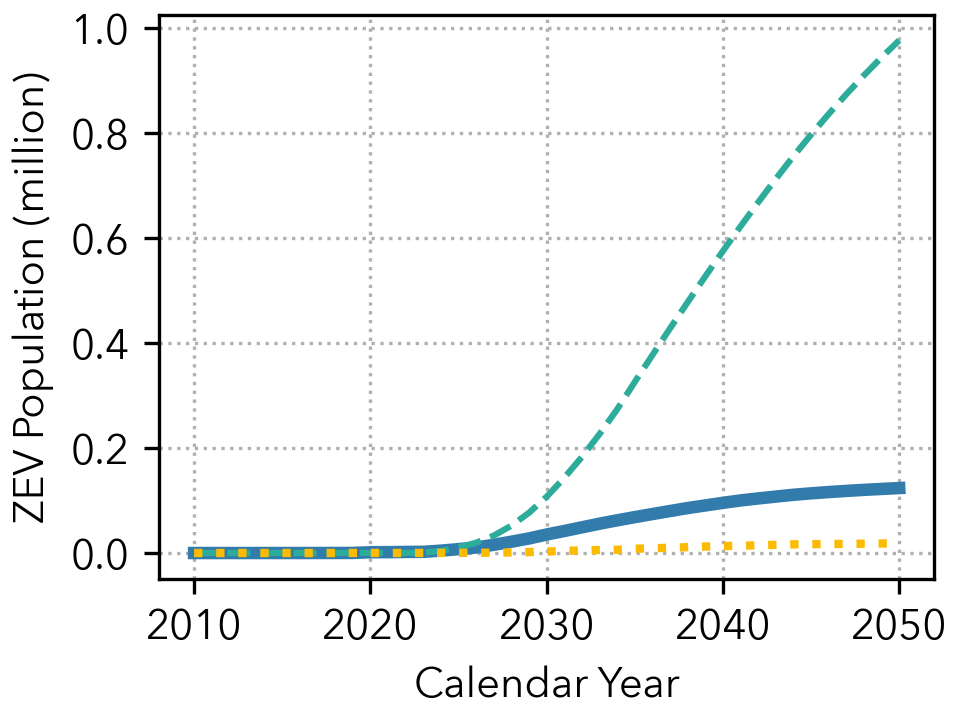
Figure 10.2 presents statewide Zero-Emissions Vehicle (ZEV; BEV and FCEV) population for EMFAC2025 and EMFAC2021. EMFAC2021 with adjustment factors in Figure 10.2 shows ZEV population estimates from regulations removed from EMFAC2021 due to federal actions (Section 9). EMFAC2025 forecasts a significant rise in ZEV population compared to EMFAC2021, driven by consumer preference for zero-emission vehicles for light-duty vehicles and regulations including ACF for medium- and heavy-duty vehicles. Medium- and heavy-duty vehicle ZEV projections are smaller in EMFAC2025 compared to EMFAC2021 due to removing the Advanced Clean Trucks (ACT) regulation. However, medium- and heavy-duty ZEV population in EMFAC2025 is higher than in EMFAC2021 with adjustment factors, as there are ZEVs increased by ACF state and local government fleet requirements. This shift to a larger ZEV fleet is a major driver of future emission reductions.
 All Vehicles
 Light-Duty (GVWR ≤ 8,000 lbs.)
 Medium- and Heavy-Duty (GVWR > 8,000 lbs.)
Figure 10.1: Statewide Vehicle Population: EMFAC2025 vs. EMFAC2021#
 All Vehicles
 Light-Duty (GVWR ≤ 8,000 lbs.)
 Medium- and Heavy-Duty (GVWR > 8,000 lbs.)
Figure 10.2: Statewide Zero-Emissions Vehicle (ZEV) Population: EMFAC2025 vs. EMFAC2021#
10.2. Vehicle Miles Traveled#
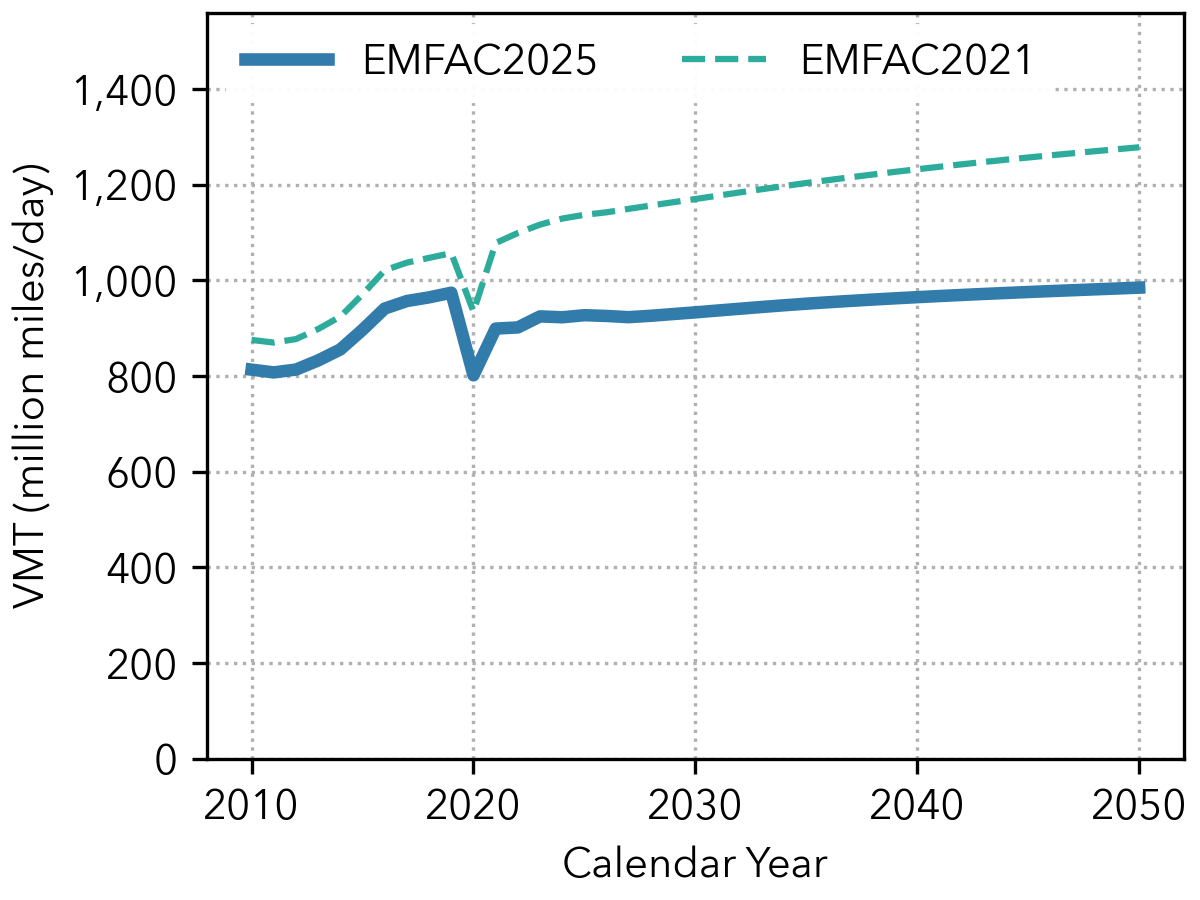
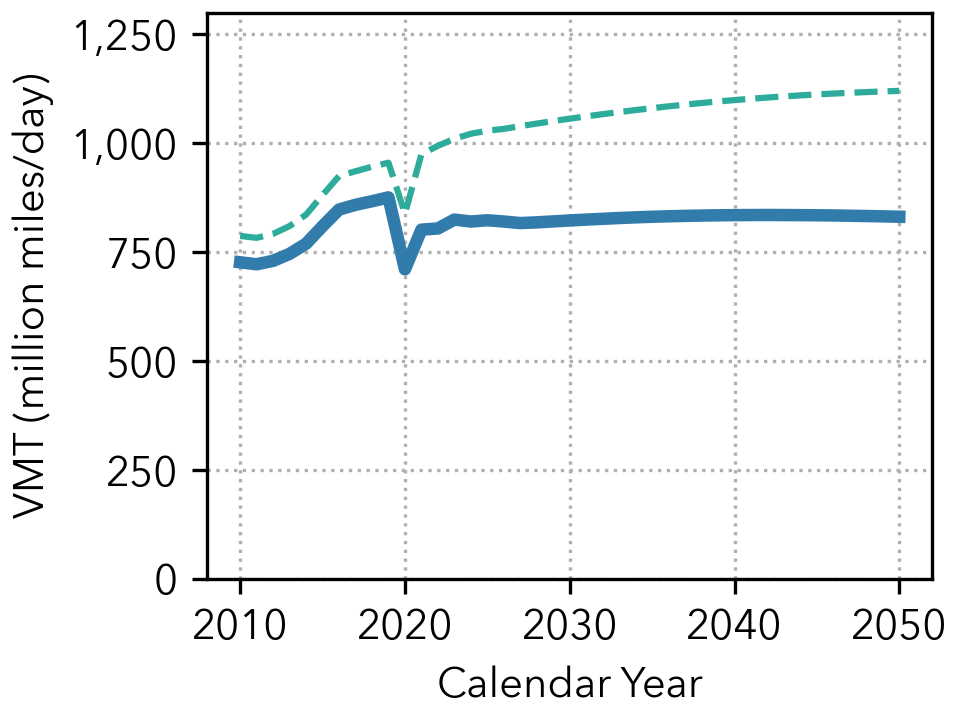
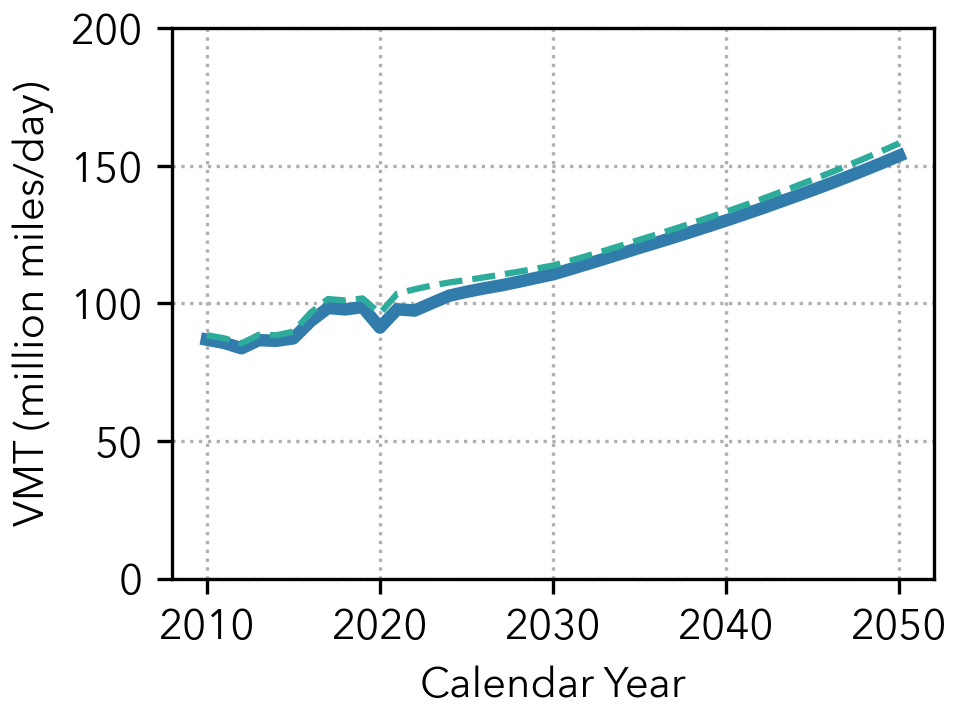
Figure 10.3 compares statewide VMT from EMFAC2021 and EMFAC2025. EMFAC2025 projects lower VMT, driven primarily by the light-duty fleet, with only small differences in medium- and heavy-duty fleets. Updated speed distributions based on the NEI dataset (Section 2.2.2) shifted EMFAC2025 speeds to both lower and higher ranges, reducing fuel efficiency. Because EMFAC constrains fuel consumption to CDTFA fuel sales data, lower efficiency results in lower overall VMT in historical years. For future years, light-duty VMT decreases stem from two factors: new speed distributions and decreased human population projections in California.
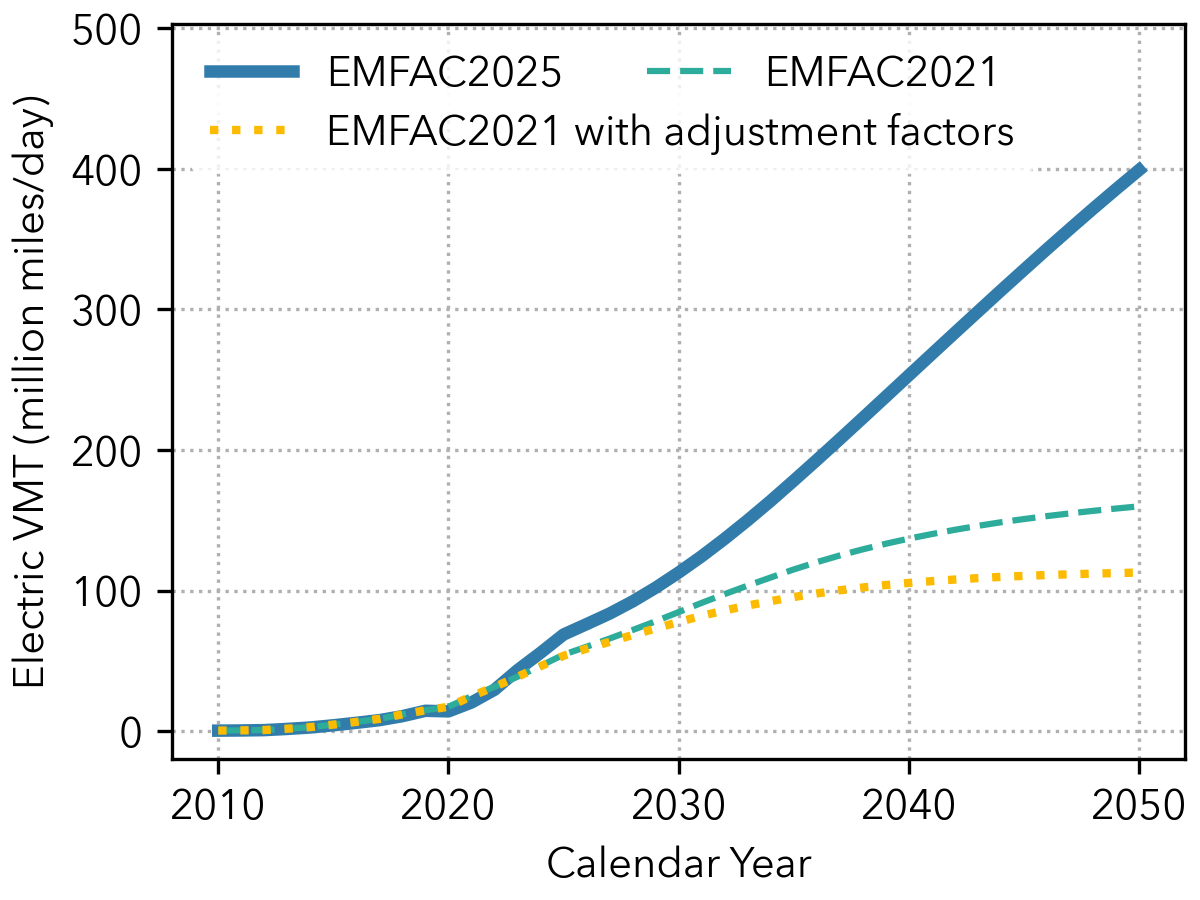
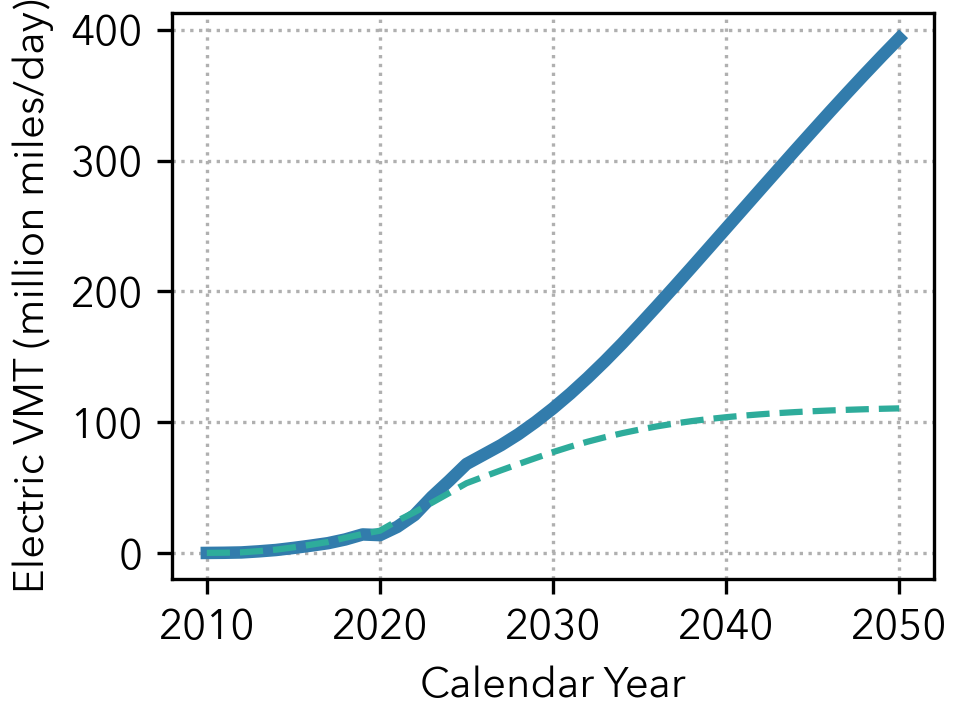
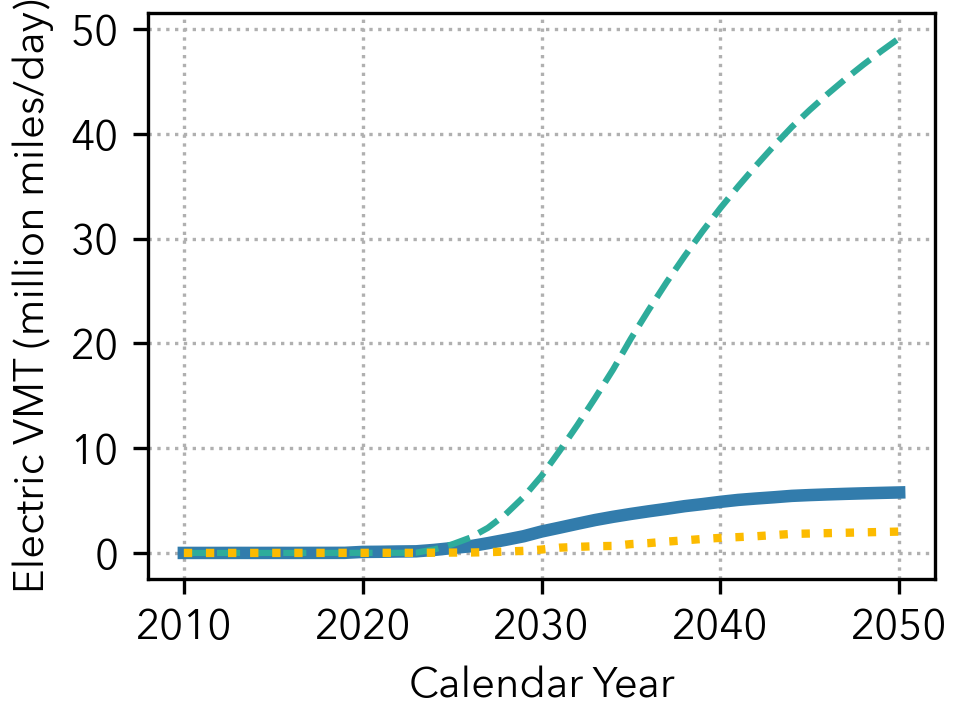
Figure 10.4 presents statewide electric vehicle miles traveled (eVMT) for EMFAC2021 and EMFAC2025. The dotted yellow line shows eVMT estimates after removing federally affected regulations. Consistent with the ZEV population trends in Figure 10.2, EMFAC2025 projects substantial light-duty eVMT growth driven by accelerated ZEV and PHEV adoption from increased consumer preference. Light-duty eVMT growth is more pronounced, though medium- and heavy-duty fleets also show increases compared to EMFAC2021 with adjustment factors, EMFAC2021, showing the effect of ACF. This eVMT growth is a key driver of future emission reductions.
 All Vehicles
 Light-Duty (GVWR ≤ 8,000 lbs.)
 Medium- and Heavy-Duty (GVWR > 8,000 lbs.)
Figure 10.3: Statewide Vehicle Miles Traveled: EMFAC2025 vs. EMFAC2021#
 All Vehicles
 Light-Duty (GVWR ≤ 8,000 lbs.)
 Medium- and Heavy-Duty (GVWR > 8,000 lbs.)
Figure 10.4: Statewide Electric Vehicle Miles Traveled: EMFAC2025 vs. EMFAC2021#
10.3. Emission Impacts#
The overall emission differences between EMFAC2025 and EMFAC2021 are primarily driven by increased ZEV population projections. For light-duty vehicles, although Age45+ vehicles (Section 2.1) and improved high-speed driving characterization (Section 2.2) increase emissions, EMFAC2025 predicts lower overall emissions than EMFAC2021, especially in later years, due to increased ZEV population and lower light-duty emission factors. For medium- and heavy-duty vehicles, emission changes are driven by new regulations: the Clean Truck Check, Advanced Clean Fleets, and Federal Clean Trucks Plan.
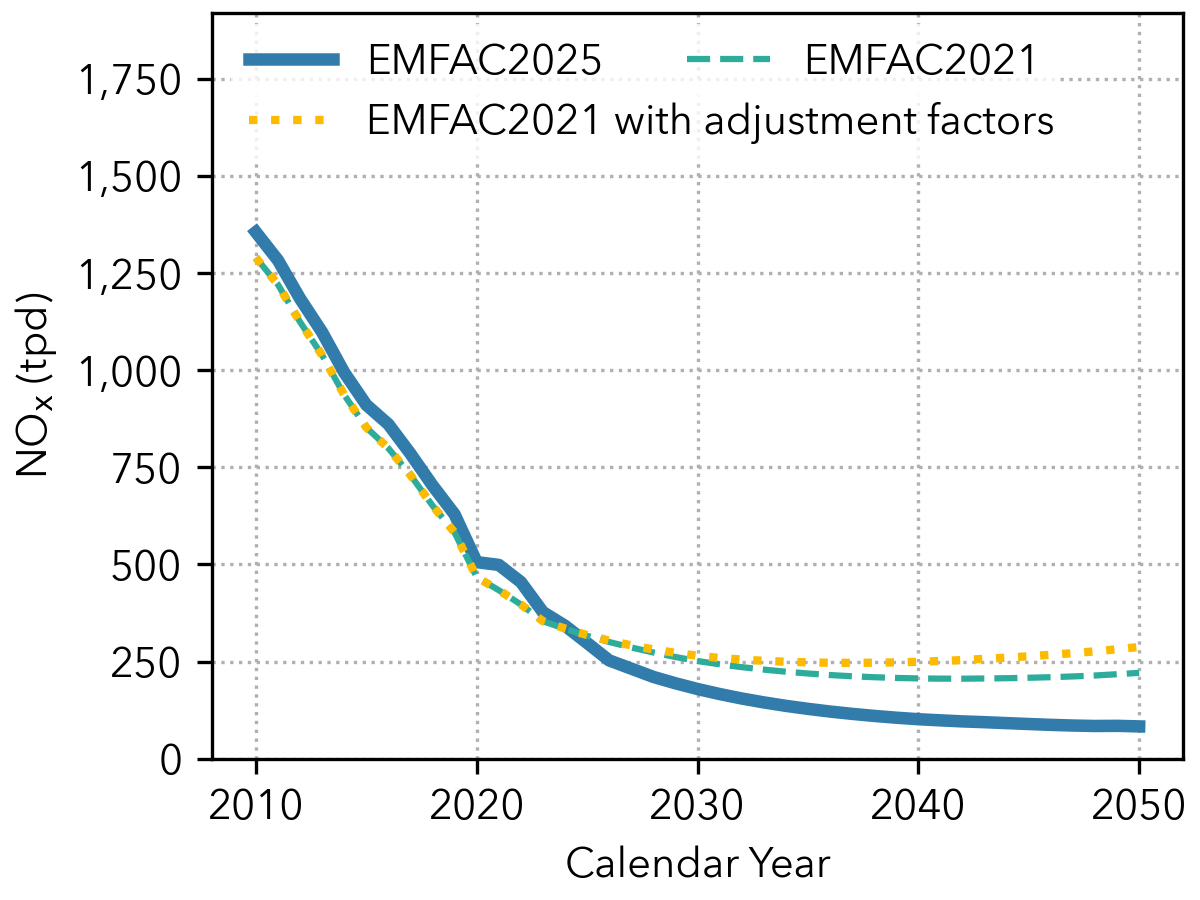
10.3.1. Oxides of Nitrogen (NOx)#
Both EMFAC2025 and EMFAC2021 show consistent NOx emission declines over time, as shown in Figure 10.5. EMFAC2025 projects slightly higher NOx emissions than EMFAC2021 before 2025, due to updated speed correction factors and Age45+ vehicle inclusion, but lower emissions from 2025 to 2050. The post-2025 reductions reflect increased ZEV population and updated base emission rates. For medium- and heavy-duty vehicles, EMFAC2025 shows lower emissions than adjusted EMFAC2021 after 2025, reflecting new regulations.
 All Vehicles
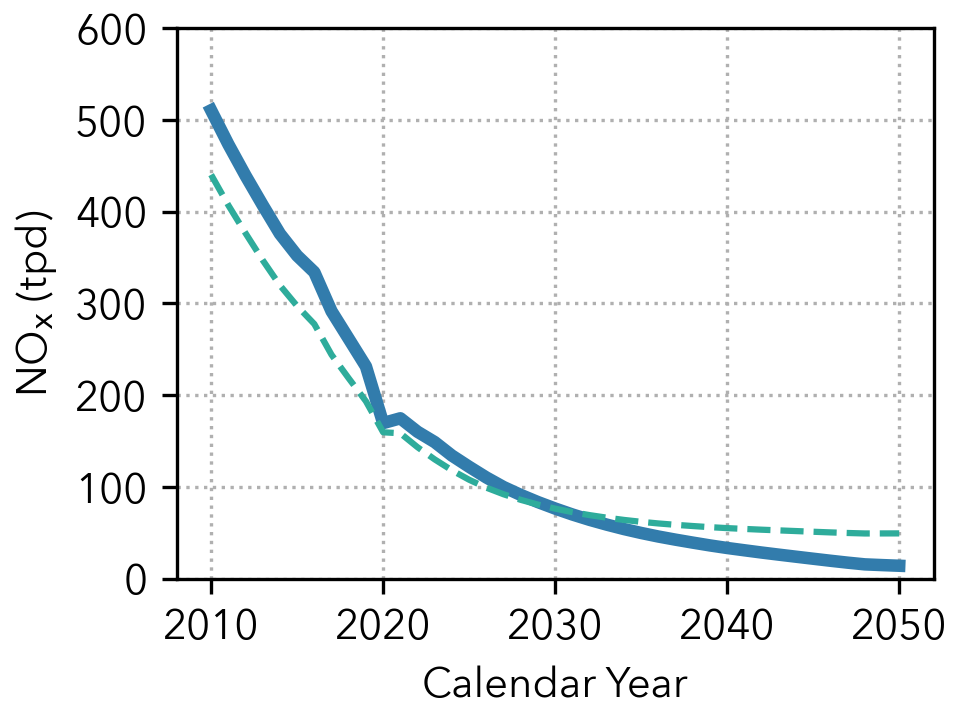 Light-Duty (GVWR ≤ 8,000 lbs.)
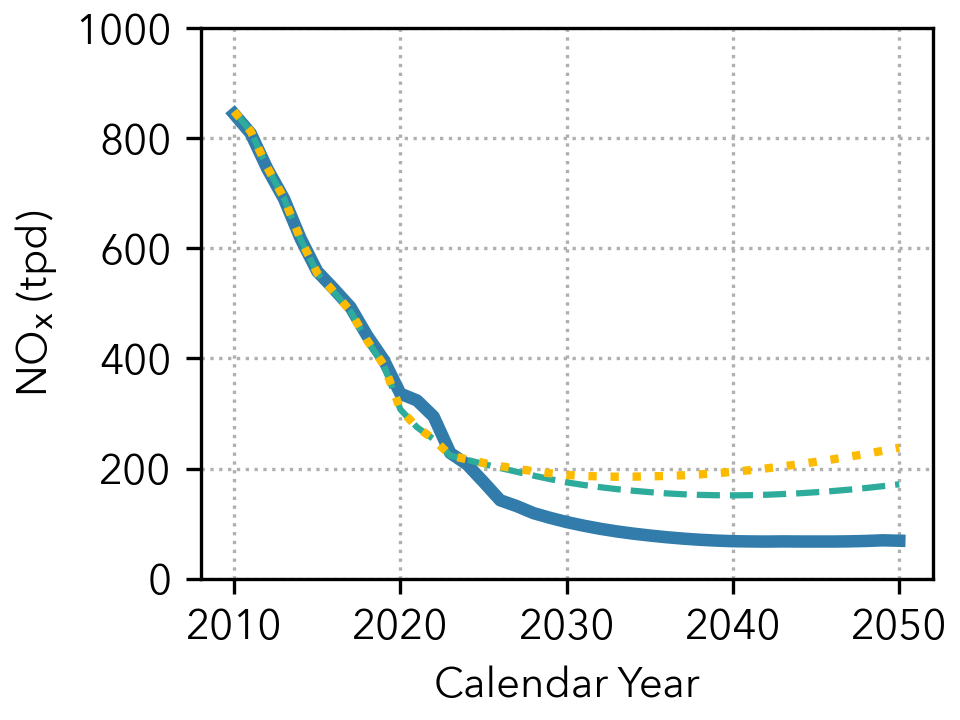 Medium- and Heavy-Duty (GVWR > 8,000 lbs.)
Figure 10.5: Statewide NOx Emissions: EMFAC2025 vs. EMFAC2021#
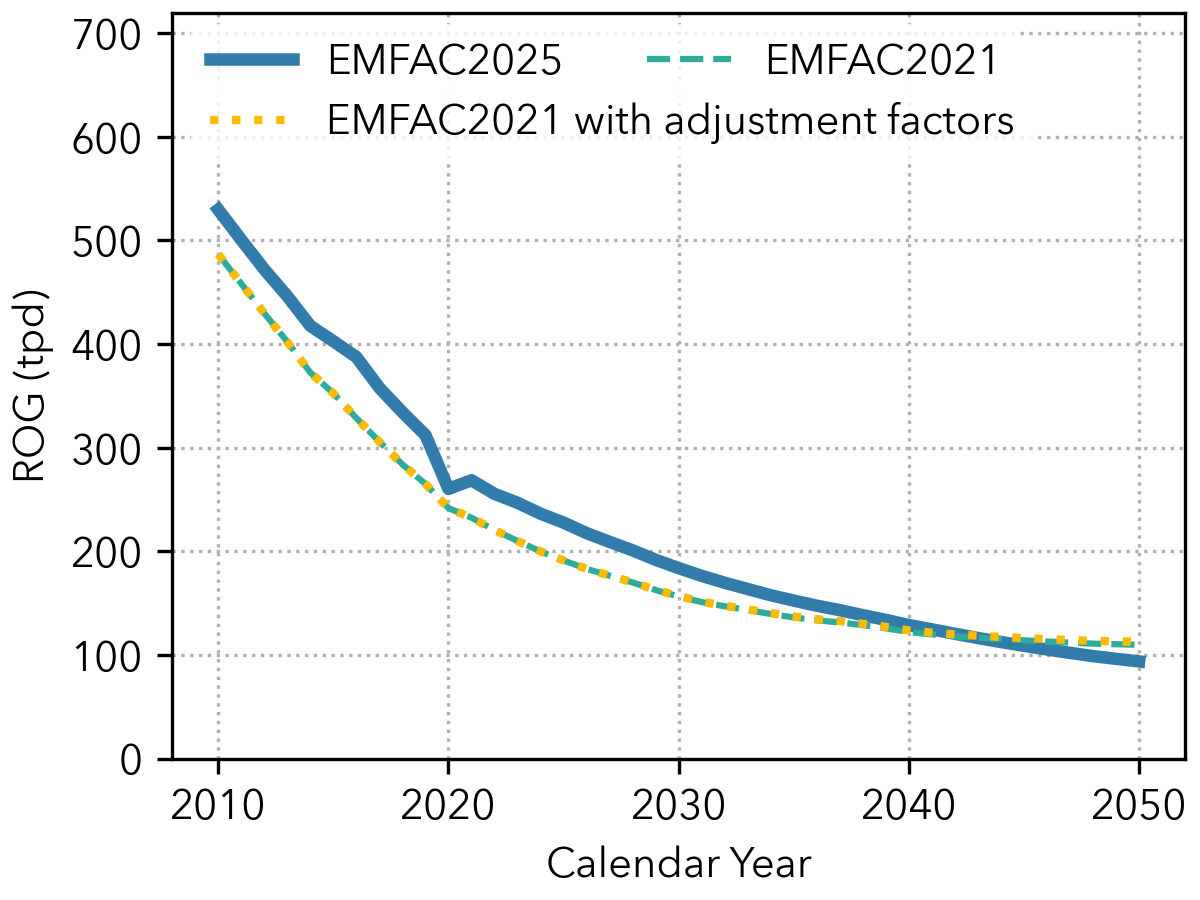
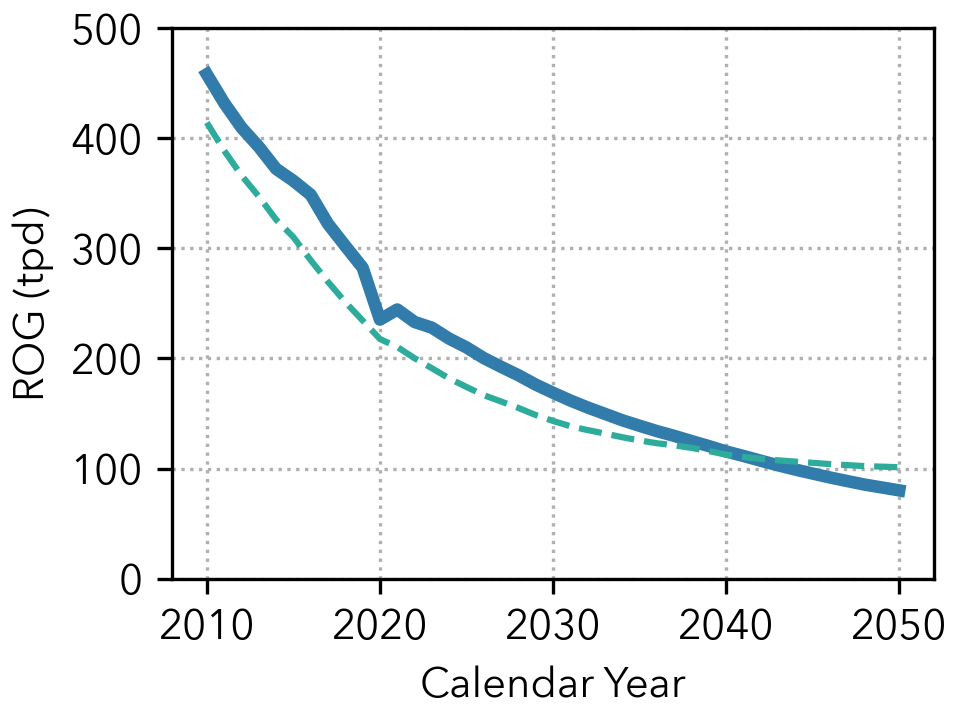
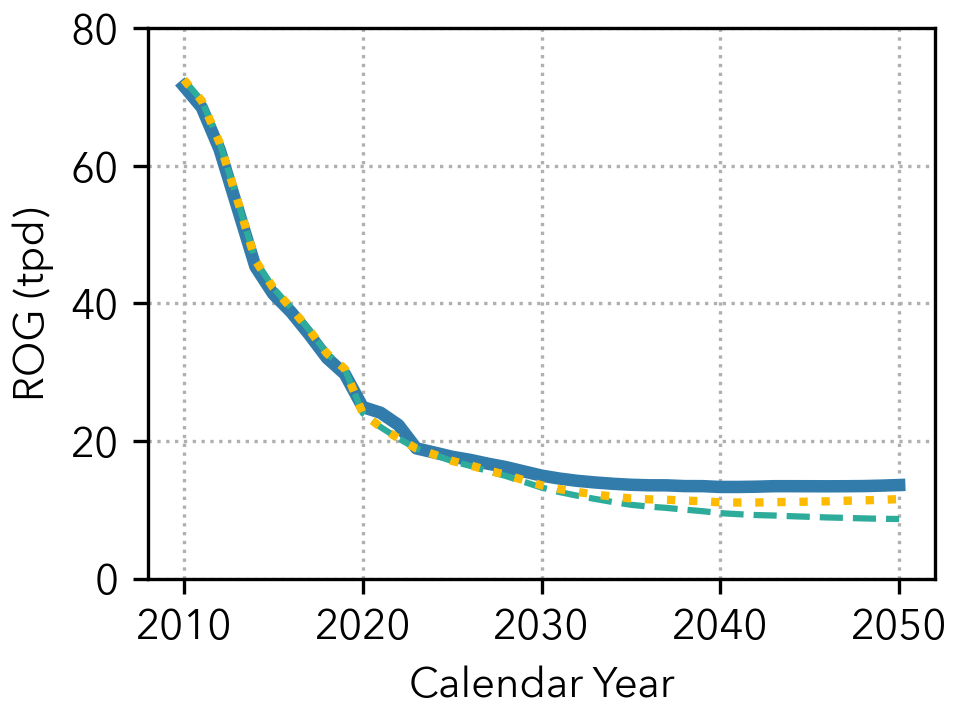
10.3.2. Reactive Organic Gases (ROG)#
Figure 10.6 shows that both EMFAC2025 and EMFAC2021 reflect steady ROG emission declines. However, EMFAC2025 shows higher ROG emissions than EMFAC2021 from 2010 to 2042, driven by elevated light-duty emissions from Age45+ fleet and high-speed driving updates. The yellow dotted line shows the effect of the federal actions on EMFAC2021 ROG emissions.
 All Vehicles
 Light-Duty (GVWR ≤ 8,000 lbs.)
 Medium- and Heavy-Duty (GVWR > 8,000 lbs.)
Figure 10.6: Statewide ROG Emissions: EMFAC2025 vs. EMFAC2021#
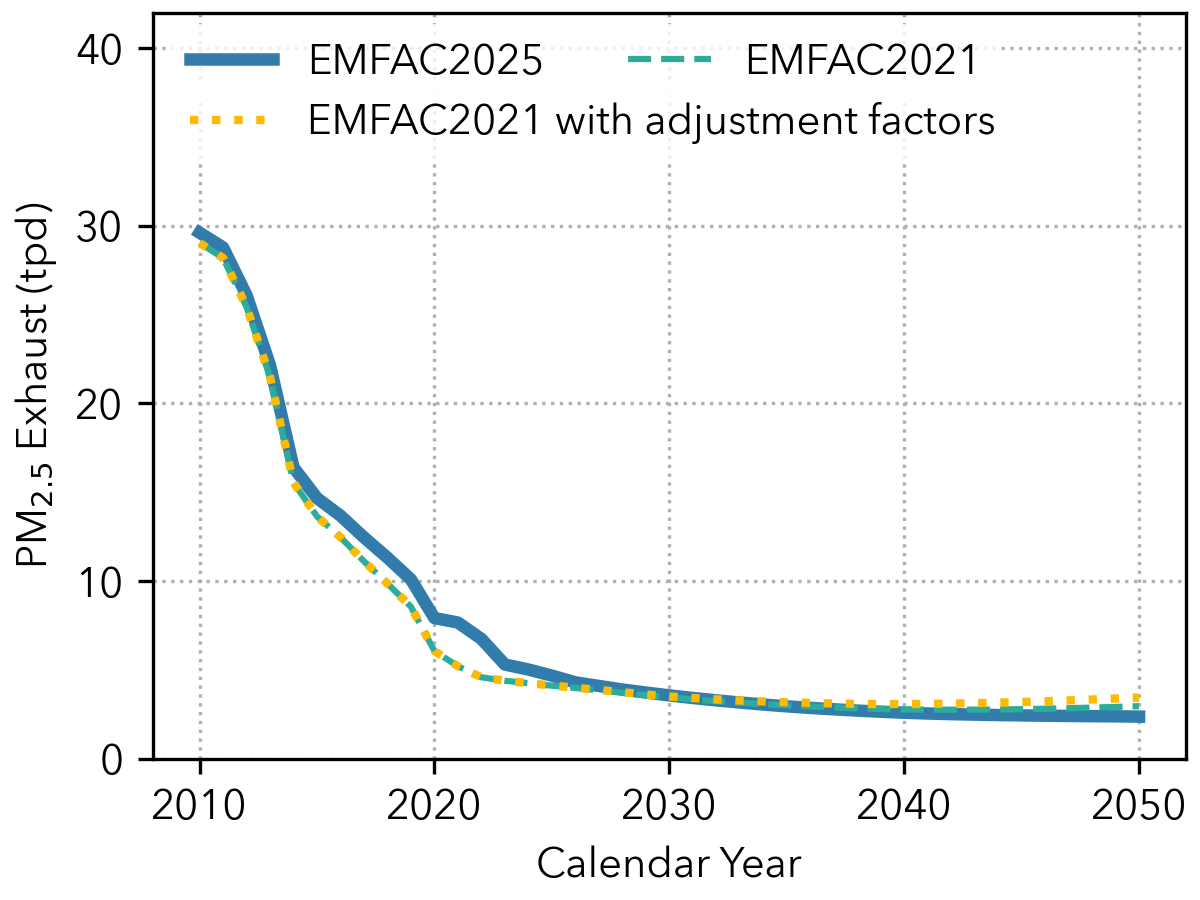
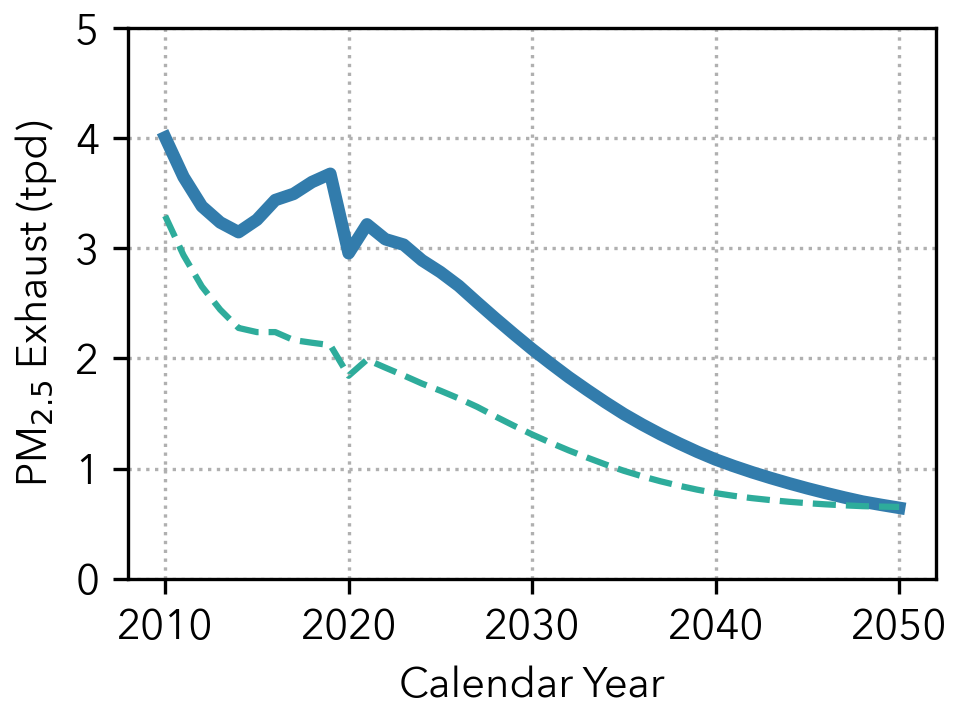
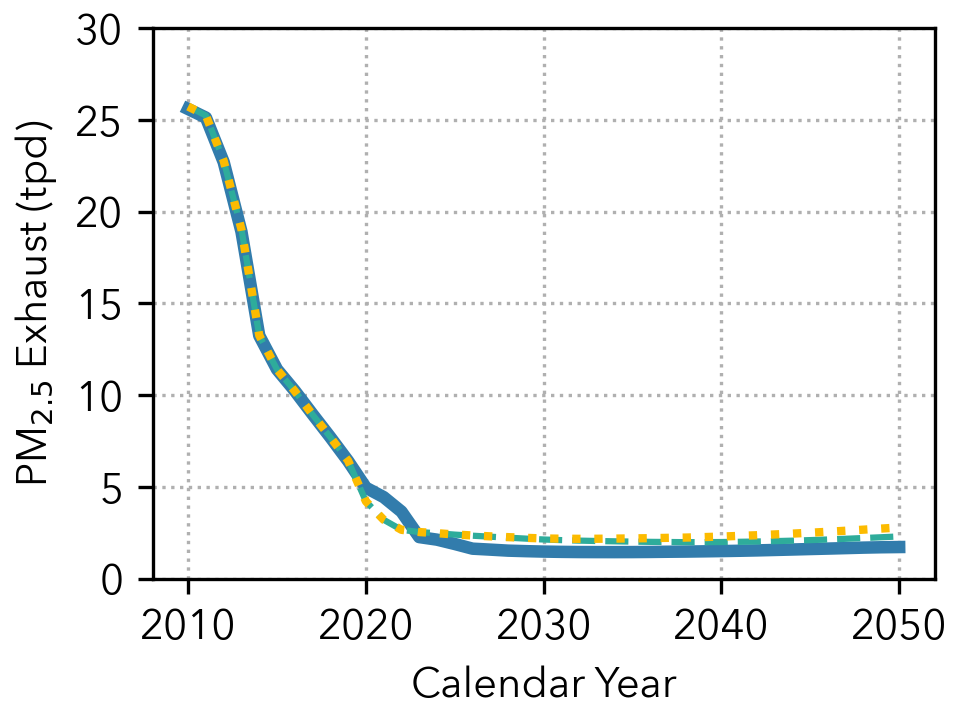
10.3.3. Exhaust Particulate Matter (PM2.5)#
Figure 10.7 compares statewide exhaust PM2.5 emissions. EMFAC2025 projects higher PM2.5 emissions than EMFAC2021 for light-duty vehicles, reflecting Age45+ fleet and high-speed driving updates. This higher projection narrows over time as the light-duty ZEV population grows. For medium- and heavy-duty vehicles, EMFAC2025 estimates lower PM2.5 emissions than EMFAC2021, reflecting the effect of new heavy-duty regulations.
 All Vehicles
 Light-Duty (GVWR ≤ 8,000 lbs.)
 Medium- and Heavy-Duty (GVWR > 8,000 lbs.)
Figure 10.7: Statewide Exhaust PM2.5 Emissions: EMFAC2025 vs. EMFAC2021#
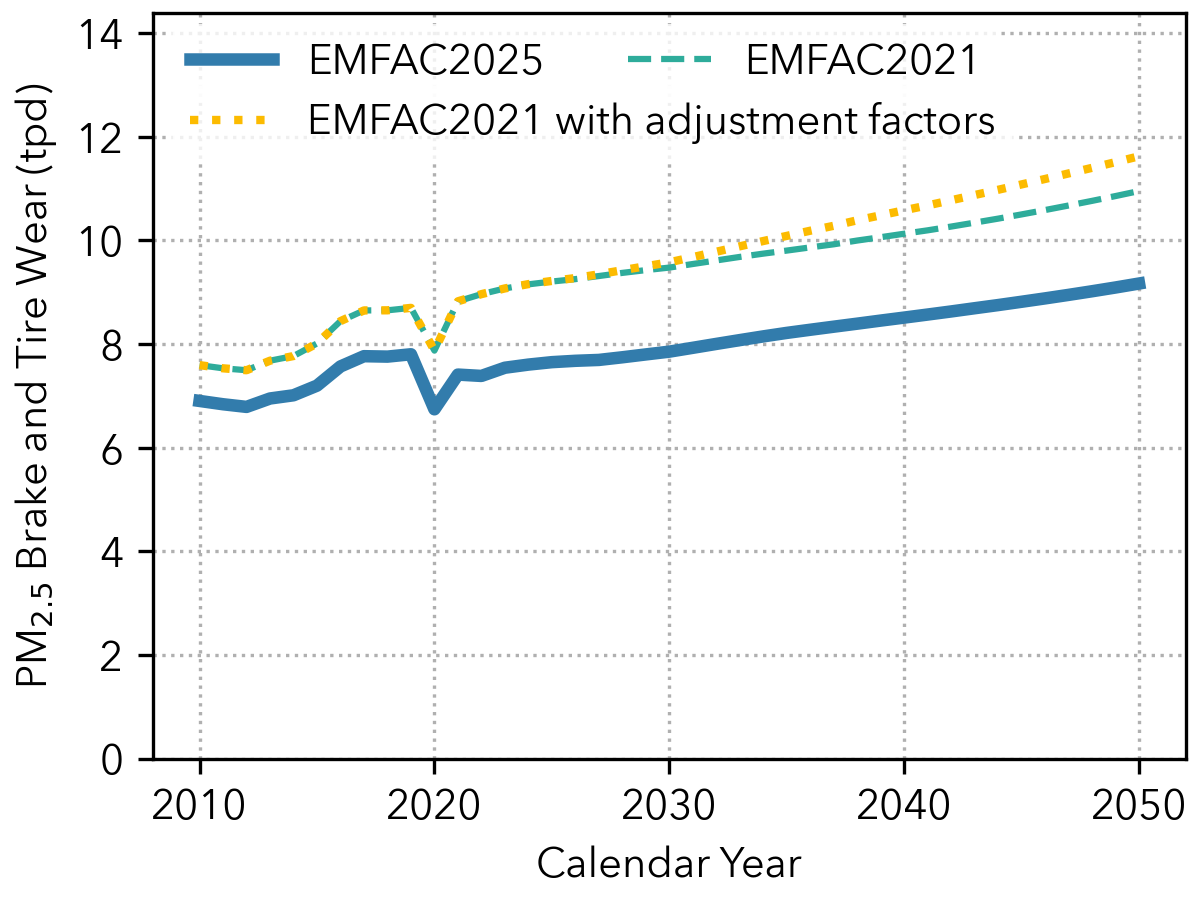
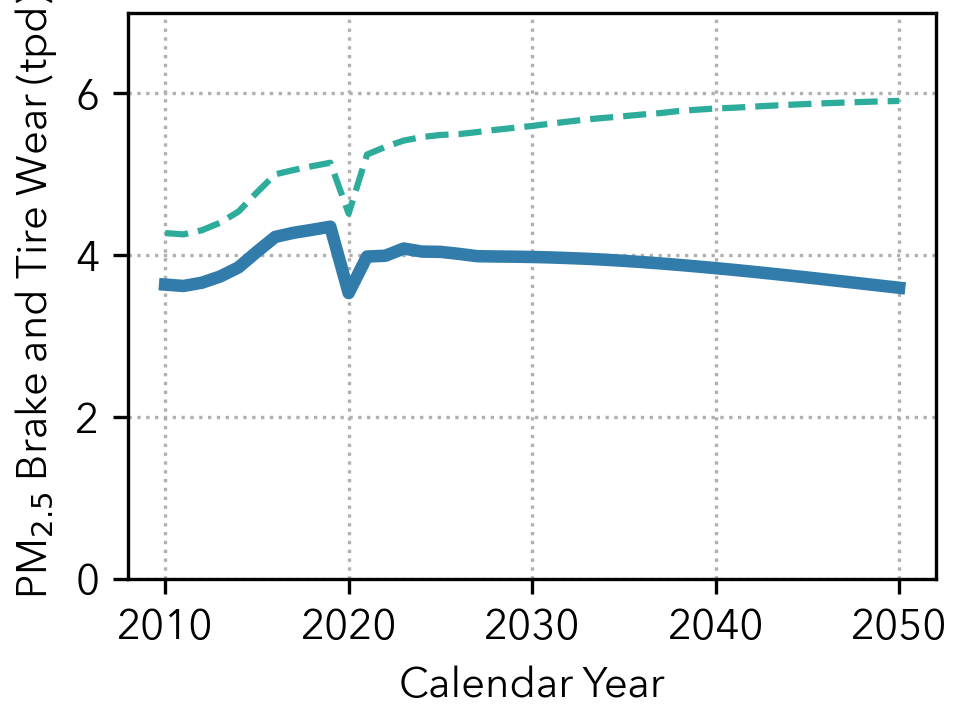
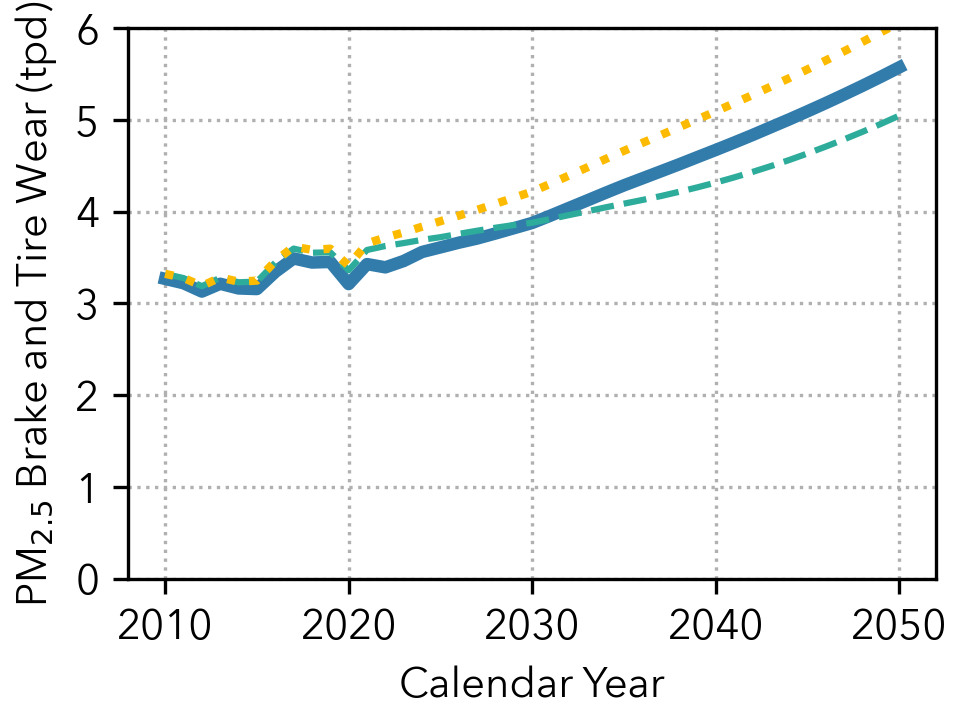
10.3.4. Brake and Tire Wear Particulate Matter (PM2.5)#
Figure 10.8 shows lower light-duty brake and tire PM2.5 emissions in EMFAC2025 from reduced VMT and increased regenerative braking as ZEV population grows. For medium- and heavy-duty vehicles, brake and tire wear PM2.5 emissions in EMFAC2025 are lower than in EMFAC2021 with adjustment factors, reflecting ZEV growth driven by ACF.
 All Vehicles
 Light-Duty (GVWR ≤ 8,000 lbs.)
 Medium- and Heavy-Duty (GVWR > 8,000 lbs.)
Figure 10.8: Statewide Brake and Tire Wear PM2.5 Emissions: EMFAC2025 vs. EMFAC2021#
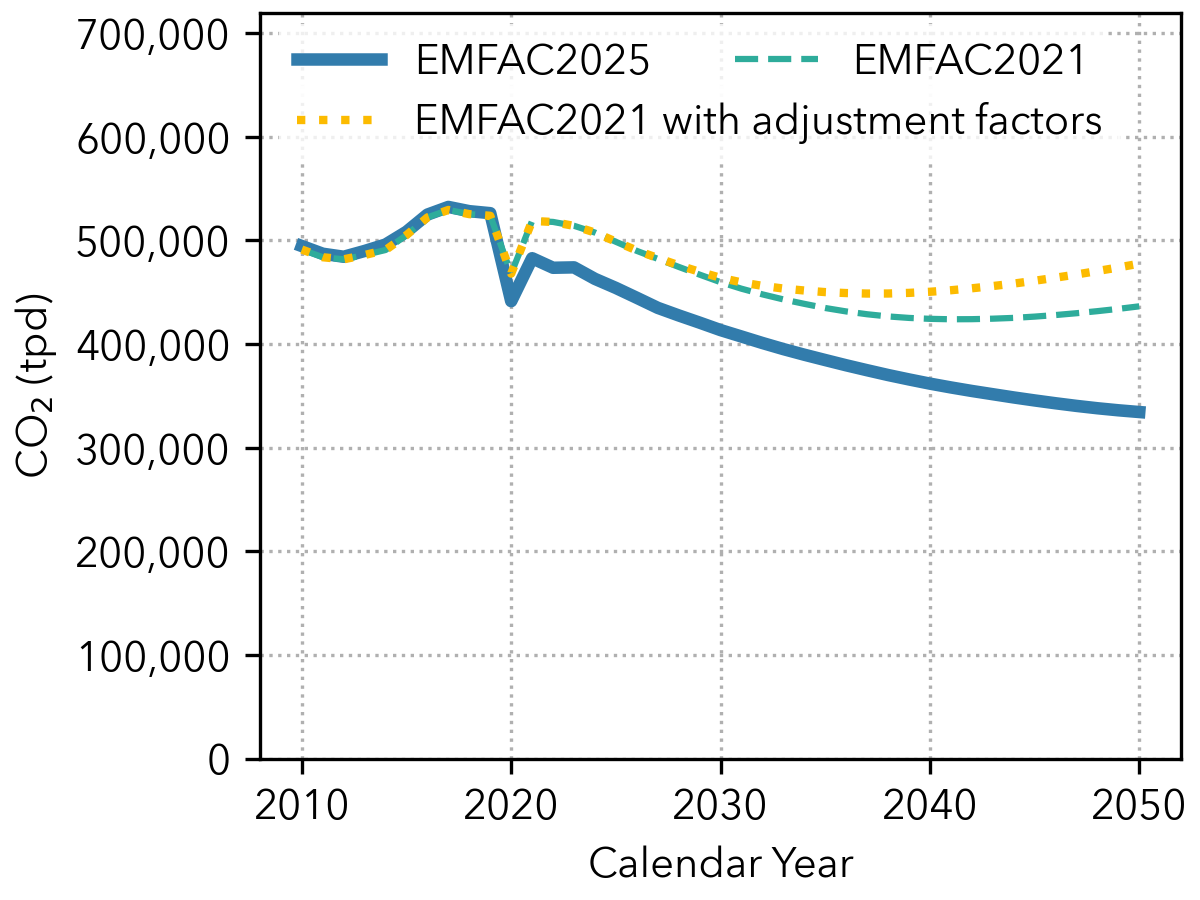
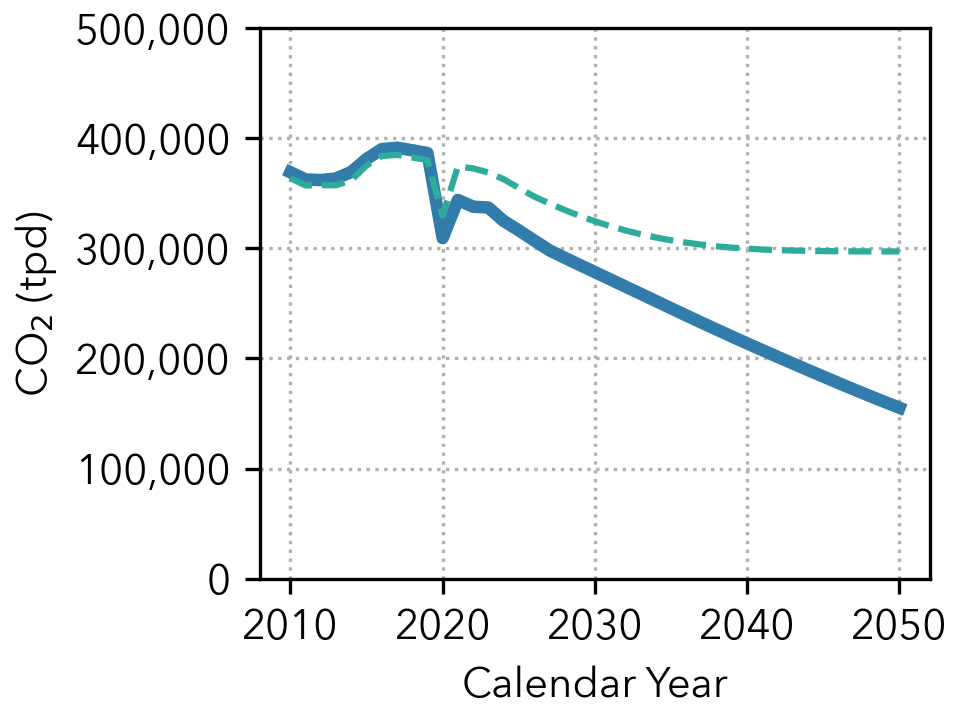
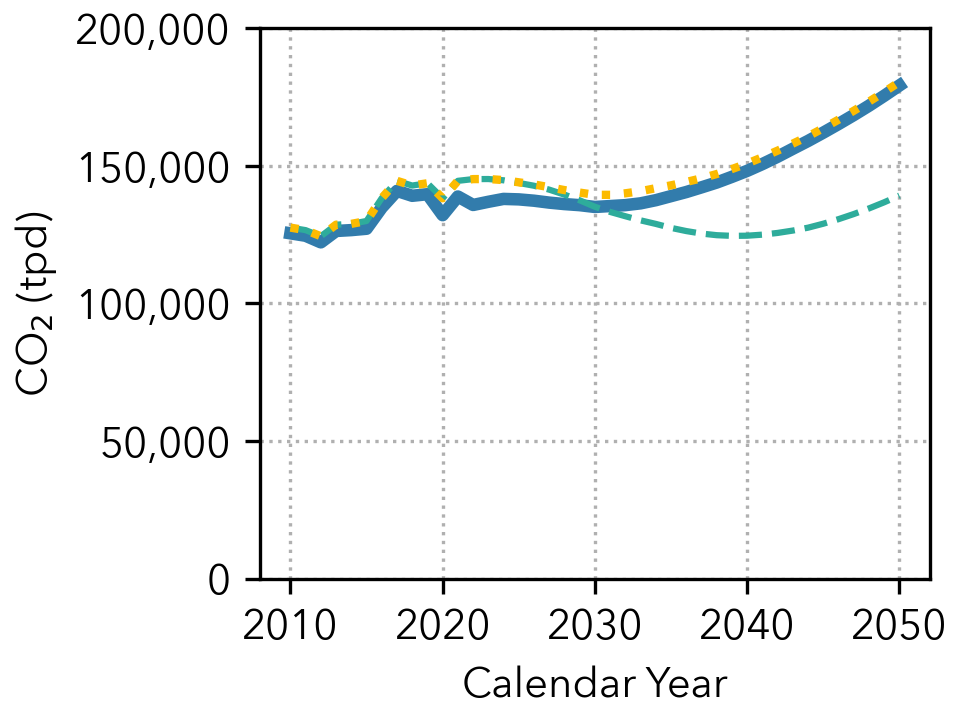
10.3.5. Carbon Dioxide (CO2)#
Figure 10.9 presents statewide CO2 emissions (tons/day) from 2010 to 2050. EMFAC2025 projects lower CO2 emissions than EMFAC2021 from increased ZEV population and reduced fuel consumption. For medium- and heavy-duty sectors, EMFAC2025 shows higher CO2 emissions from regulations removed by 2025 congressional resolutions, including ACT.
 All Vehicles
 Light-Duty (GVWR ≤ 8,000 lbs.)
 Medium- and Heavy-Duty (GVWR > 8,000 lbs.)
Figure 10.9: Statewide CO2 Emissions: EMFAC2025 vs. EMFAC2021#
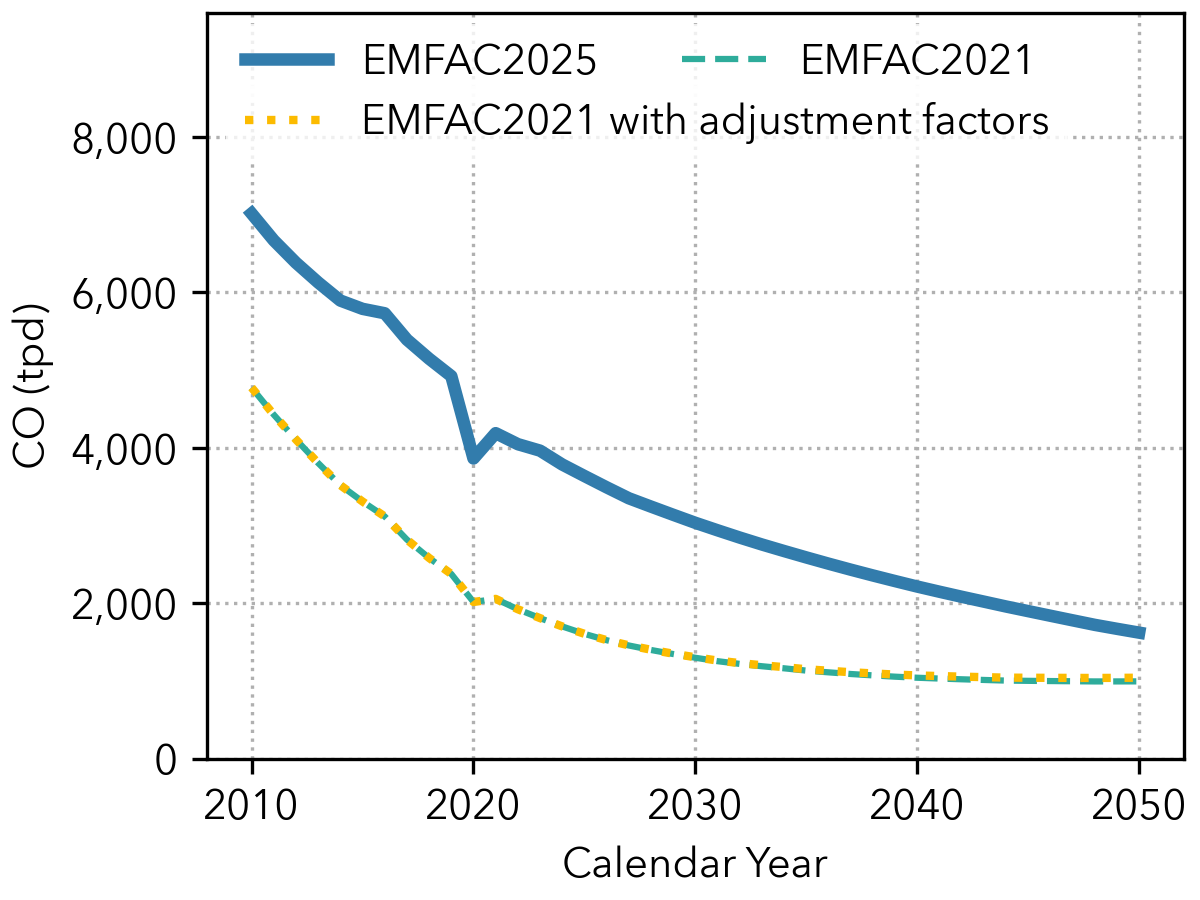
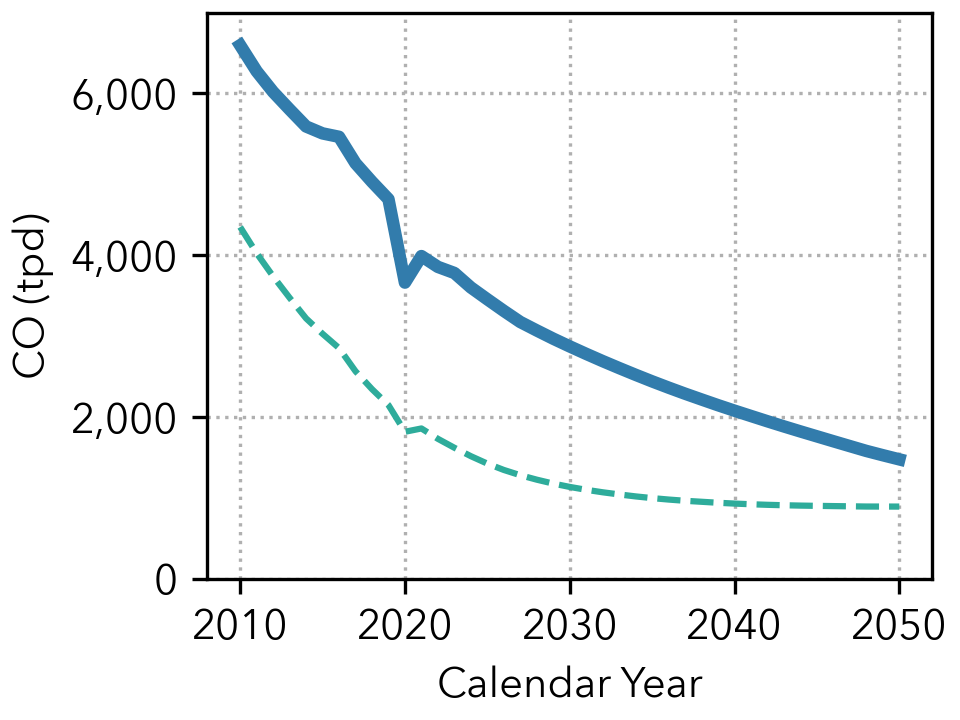
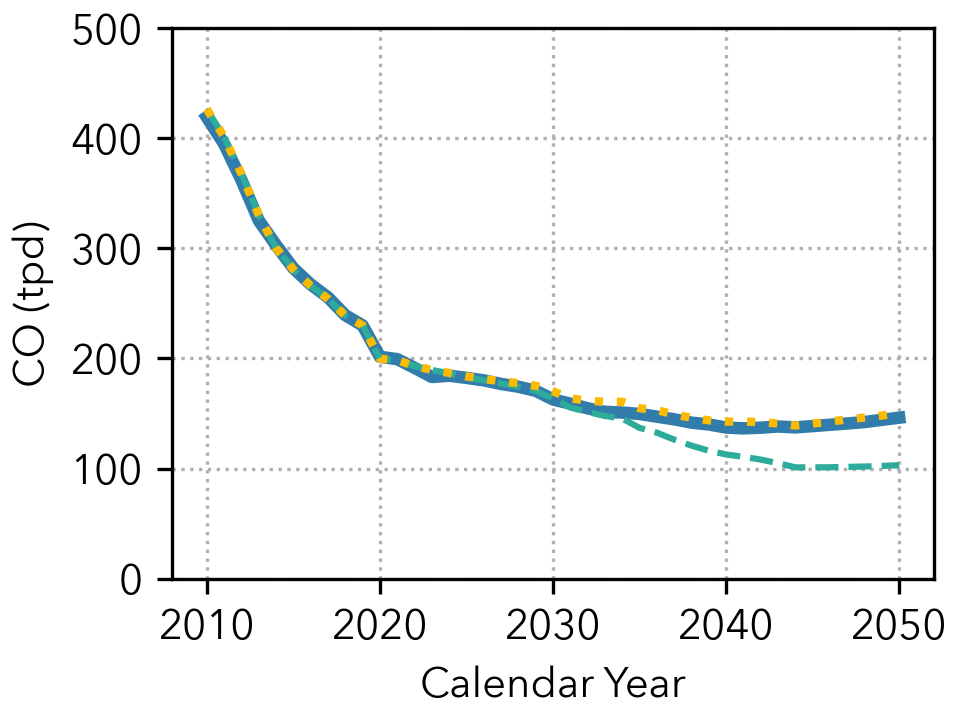
10.3.6. Carbon Monoxide (CO)#
Light-duty vehicles dominate statewide CO emissions, as shown in Figure 10.10. EMFAC2025 projects higher CO emissions than EMFAC2021 from high-speed correction factors for CO and driving activity above 70 mph. Despite the increased ZEV population, CO emissions in EMFAC2025 remain higher throughout the projection period than in EMFAC2021.
 All Vehicles
 Light-Duty (GVWR ≤ 8,000 lbs.)
 Medium- and Heavy-Duty (GVWR > 8,000 lbs.)
Figure 10.10: Statewide CO Emissions: EMFAC2025 vs. EMFAC2021#
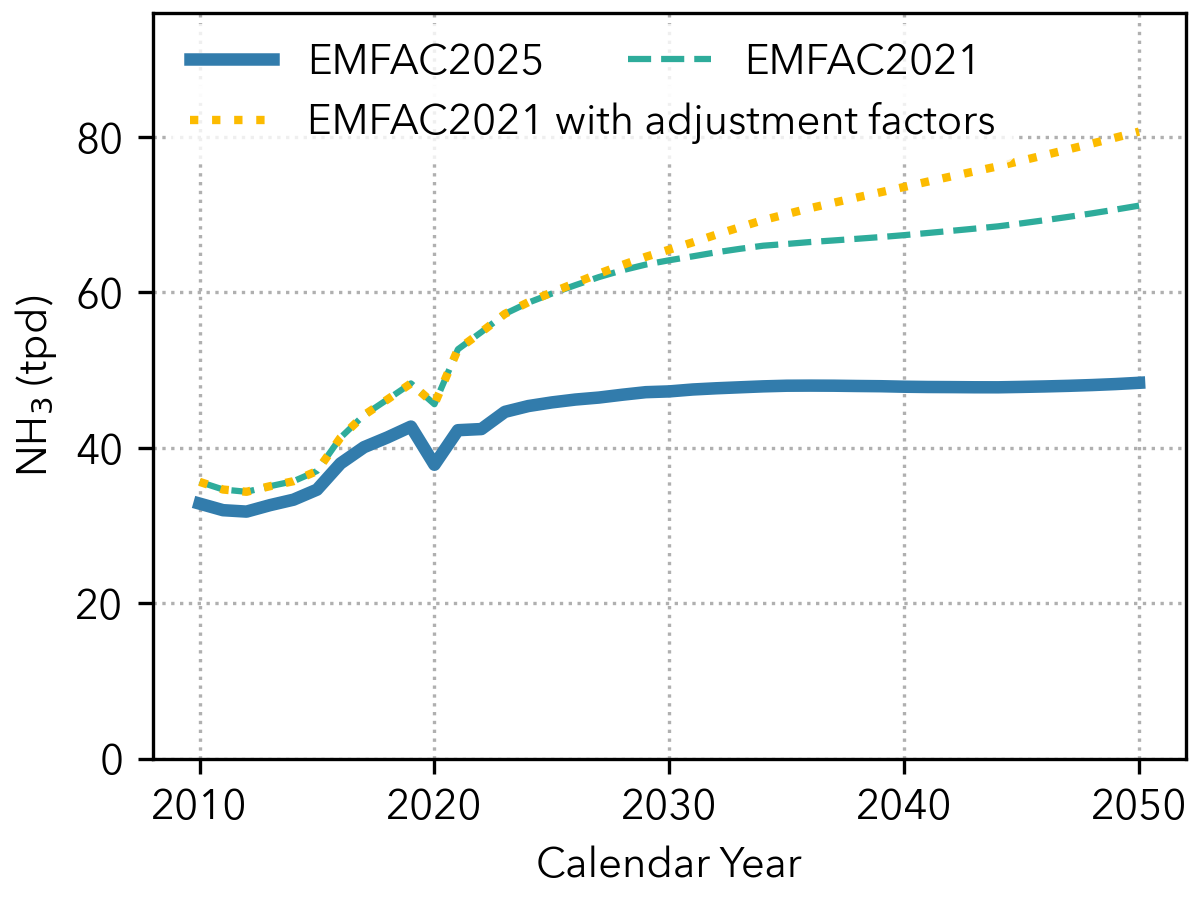
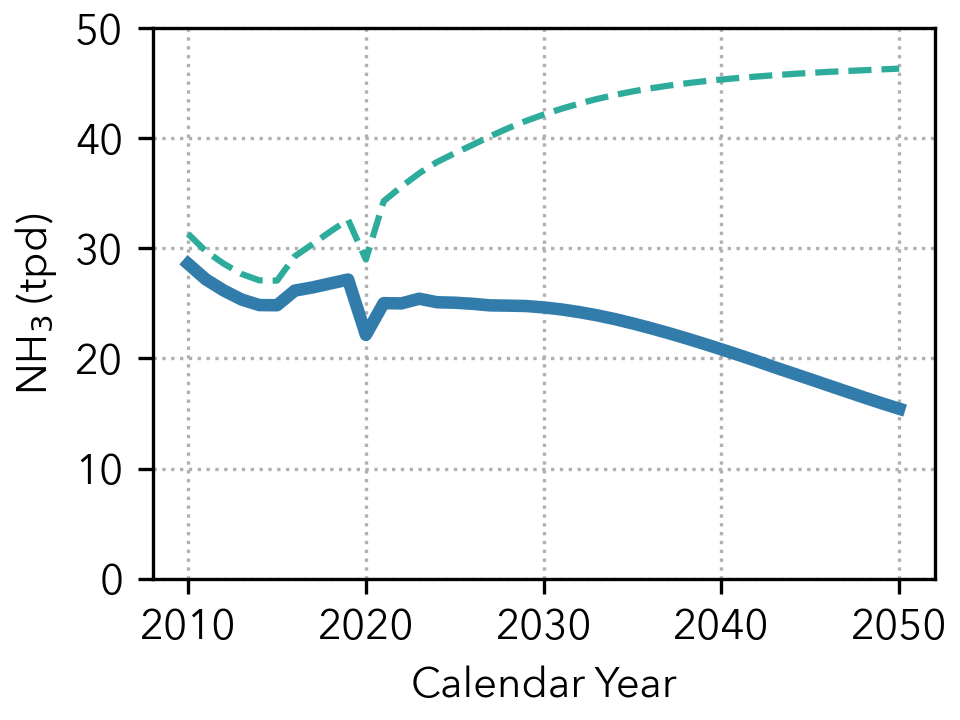
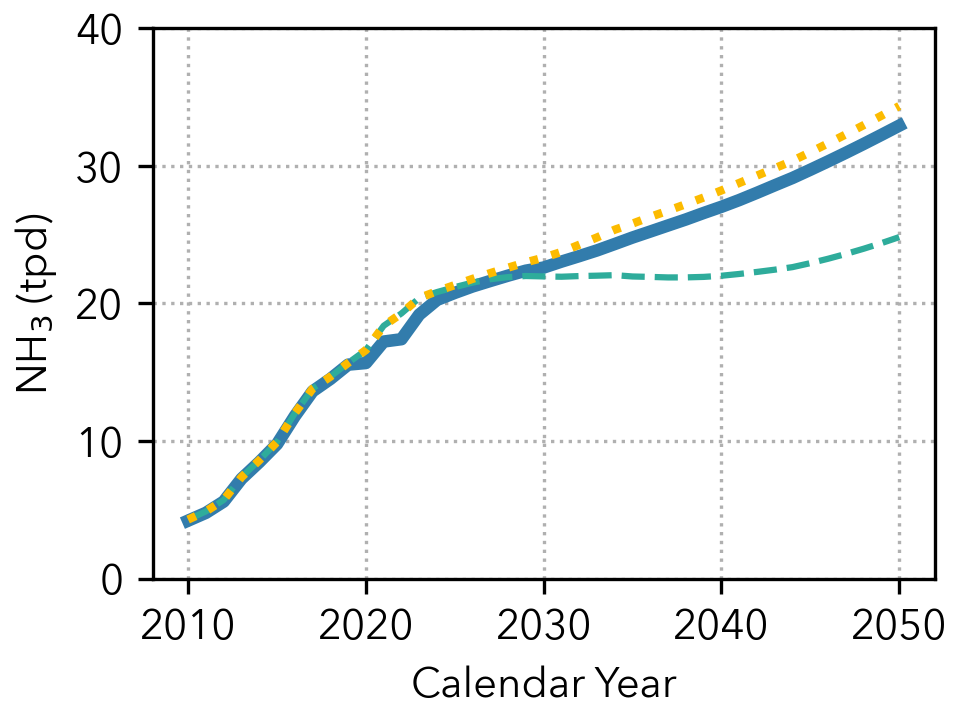
10.3.7. Ammonia (NH3)#
Figure 10.11 compares NH3 emissions from EMFAC2025 and EMFAC2021. Light-duty NH3 emissions are lower in EMFAC2025 due to lower VMT projections and increased ZEV population. Medium- and heavy-duty NH3 emissions are higher in EMFAC2025 from removed regulations, but lower than adjusted EMFAC2021, reflecting the effect of ACF.
 All Vehicles
 Light-Duty (GVWR ≤ 8,000 lbs.)
 Medium- and Heavy-Duty (GVWR > 8,000 lbs.)
Figure 10.11: Statewide NH3 Emissions: EMFAC2025 vs. EMFAC2021#
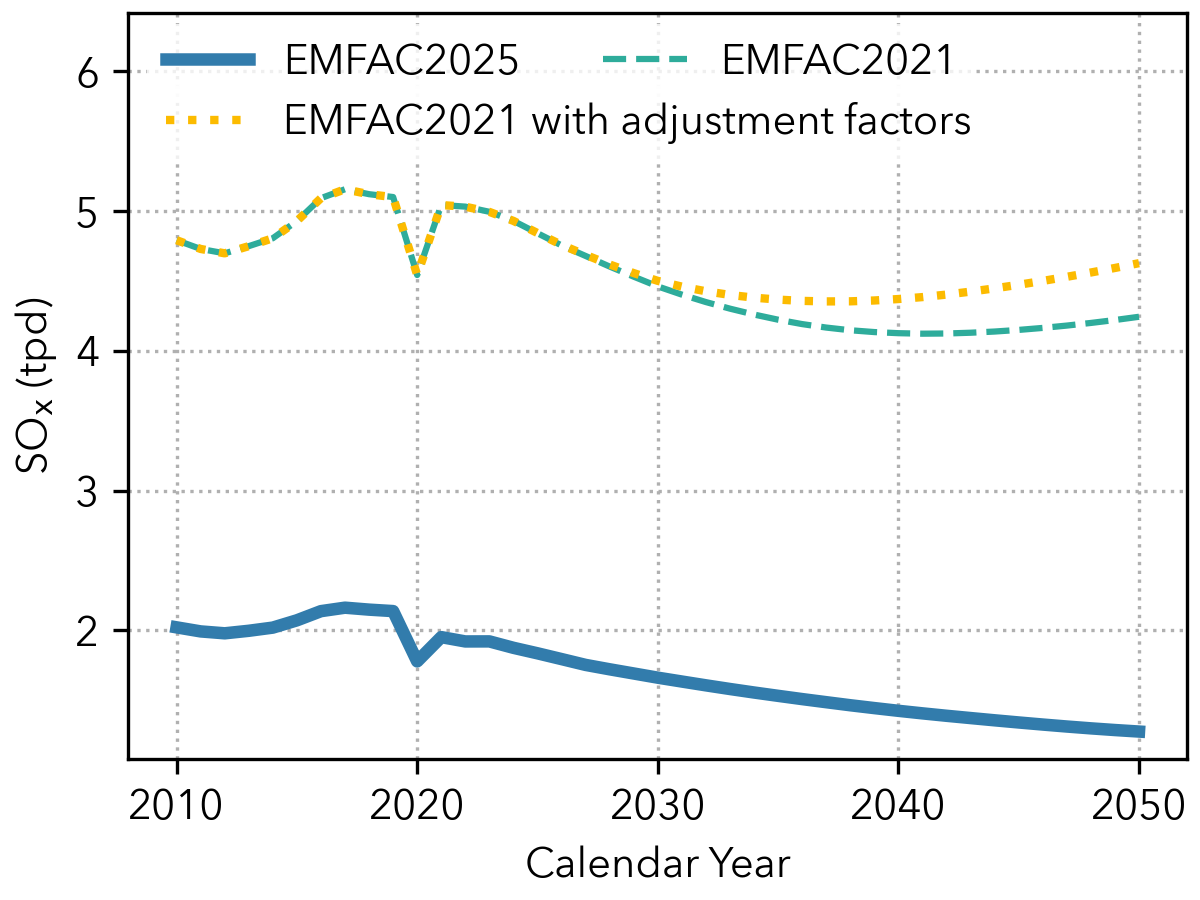
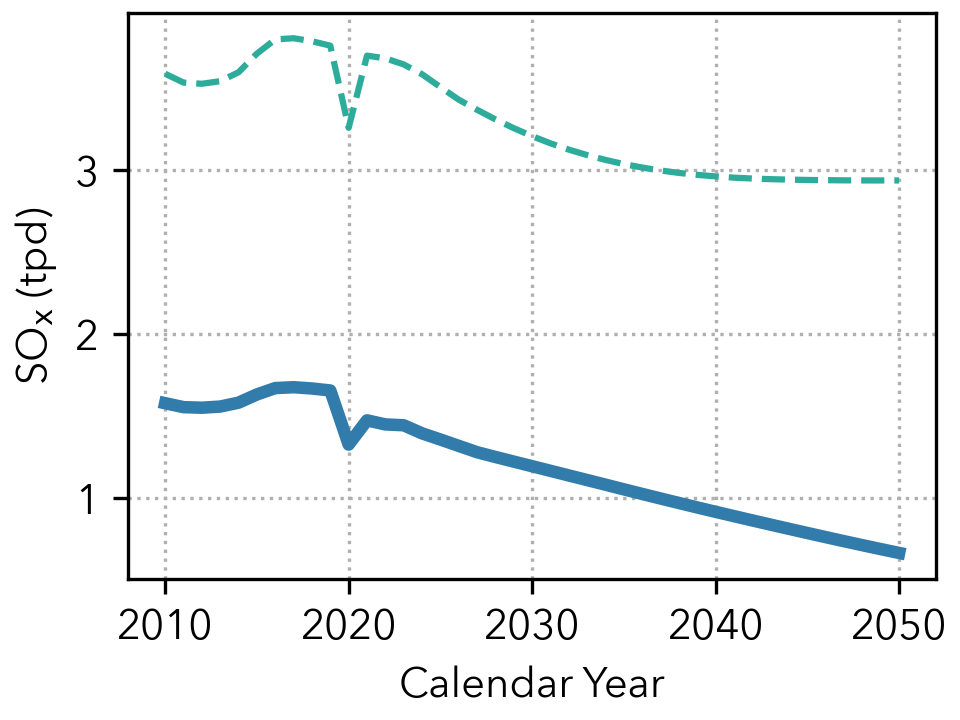
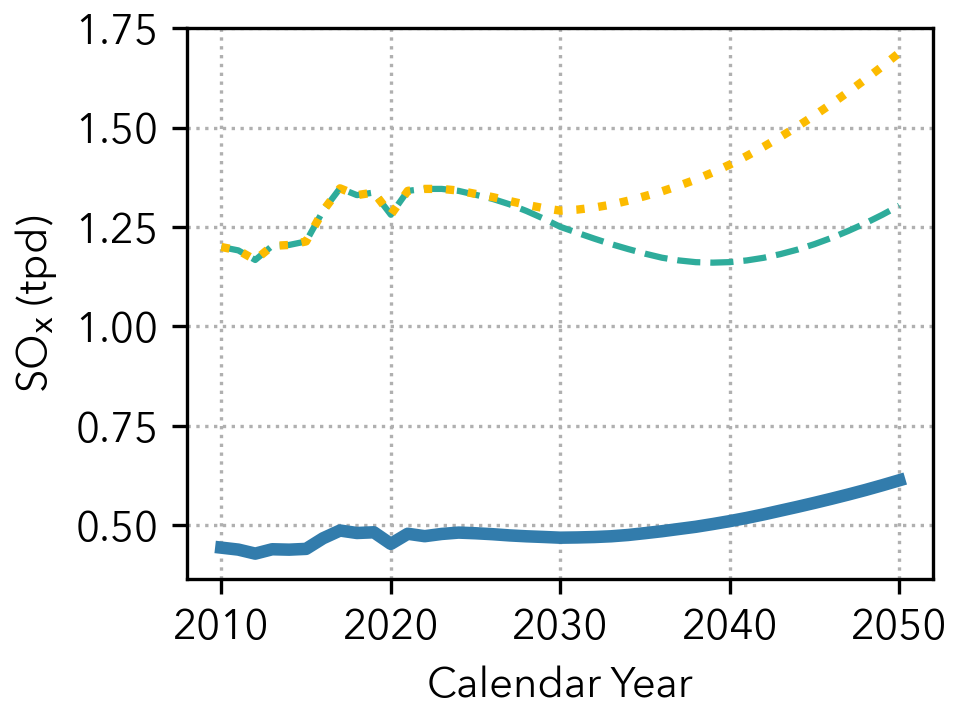
10.3.8. Oxides of Sulfur (SOx)#
Figure 10.12 compares statewide SOx emissions (tons/day) from 2010 to 2050. Lower SOx emissions in EMFAC2025 result from lower VMT and updated sulfur content informed by a recent CARB study (See Section 7.2). This study found lower sulfur content in California fuel samples than previously estimated: 6.5 ppm for gasoline and 5.2 ppm for diesel (versus 15 ppm for both in EMFAC2021). These changes produce dramatic SOx reductions in historical years. SOx emissions decline further in future years due to the increased ZEV population.
 All Vehicles
 Light-Duty (GVWR ≤ 8,000 lbs.)
 Medium- and Heavy-Duty (GVWR > 8,000 lbs.)
Figure 10.12: Statewide SOx Emissions: EMFAC2025 vs. EMFAC2021#
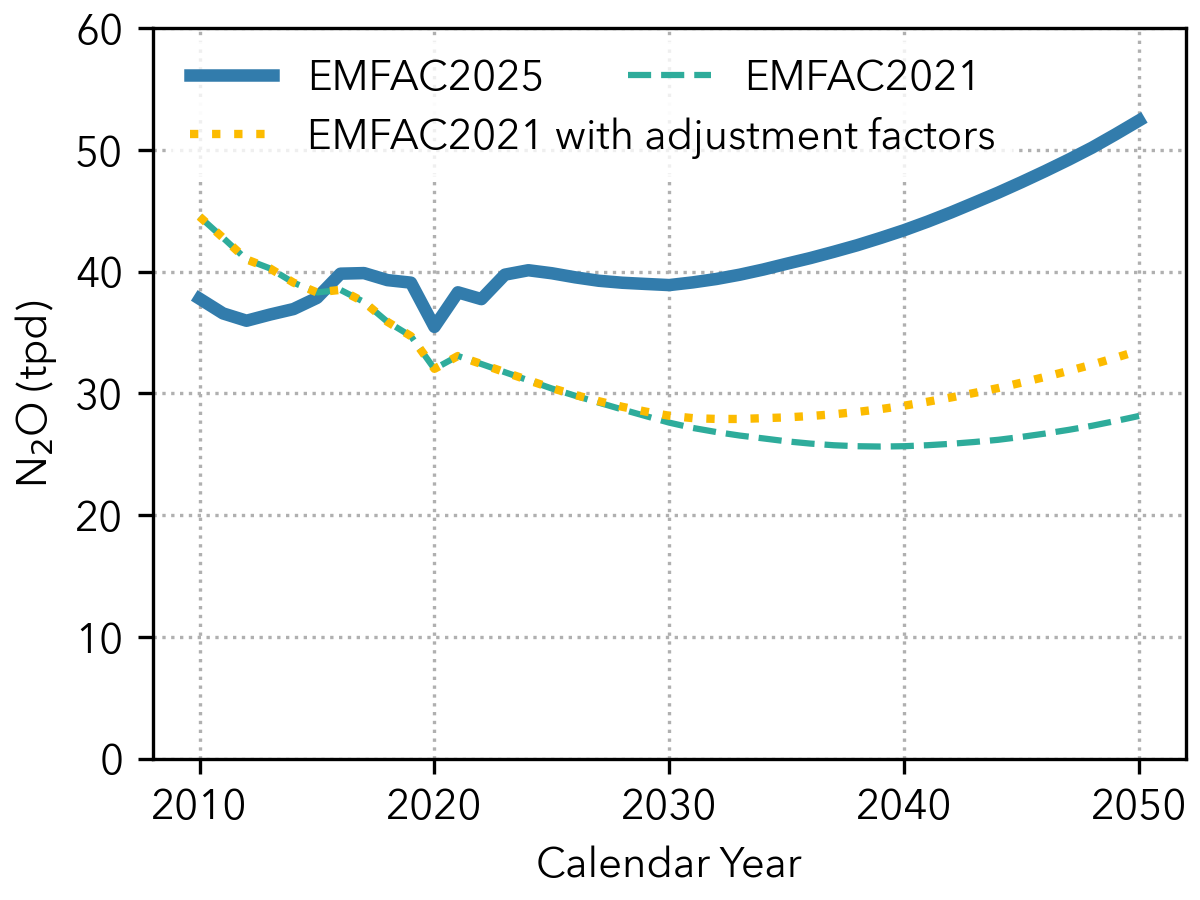
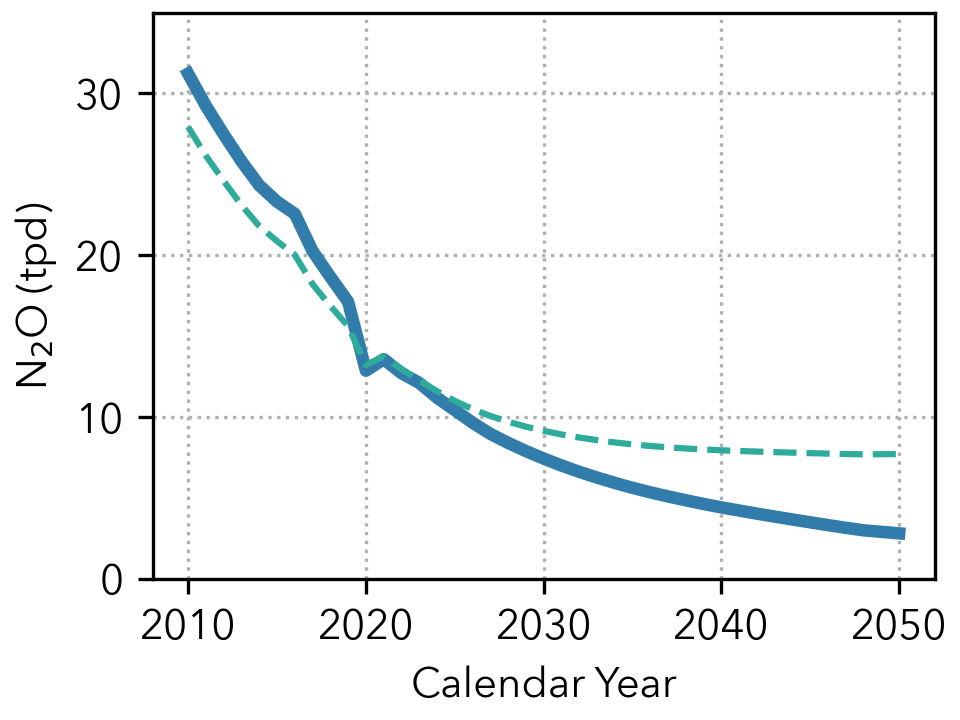
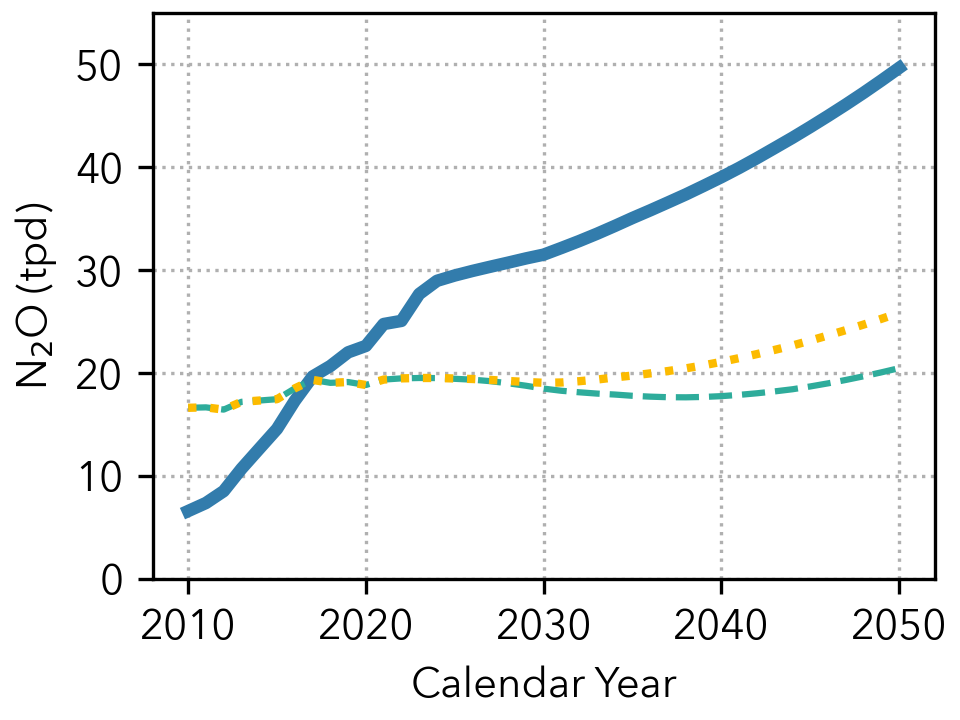
10.3.9. Nitrous Oxide (N2O)#
Figure 10.13 compares statewide N2O emissions (tons/day) from 2010 to 2050. N2O trends are primarily driven by updates to heavy-duty emissions (Section 5.3). Pre-2011 chassis trucks show decreased N2O emissions; however, from model year 2011 onward, SCR after-treatment systems for NOx reduction cause increased N2O emissions in EMFAC2025 compared to EMFAC2021.
 All Vehicles
 Light-Duty (GVWR ≤ 8,000 lbs.)
 Medium- and Heavy-Duty (GVWR > 8,000 lbs.)
Figure 10.13: Statewide N2O Emissions: EMFAC2025 vs. EMFAC2021#
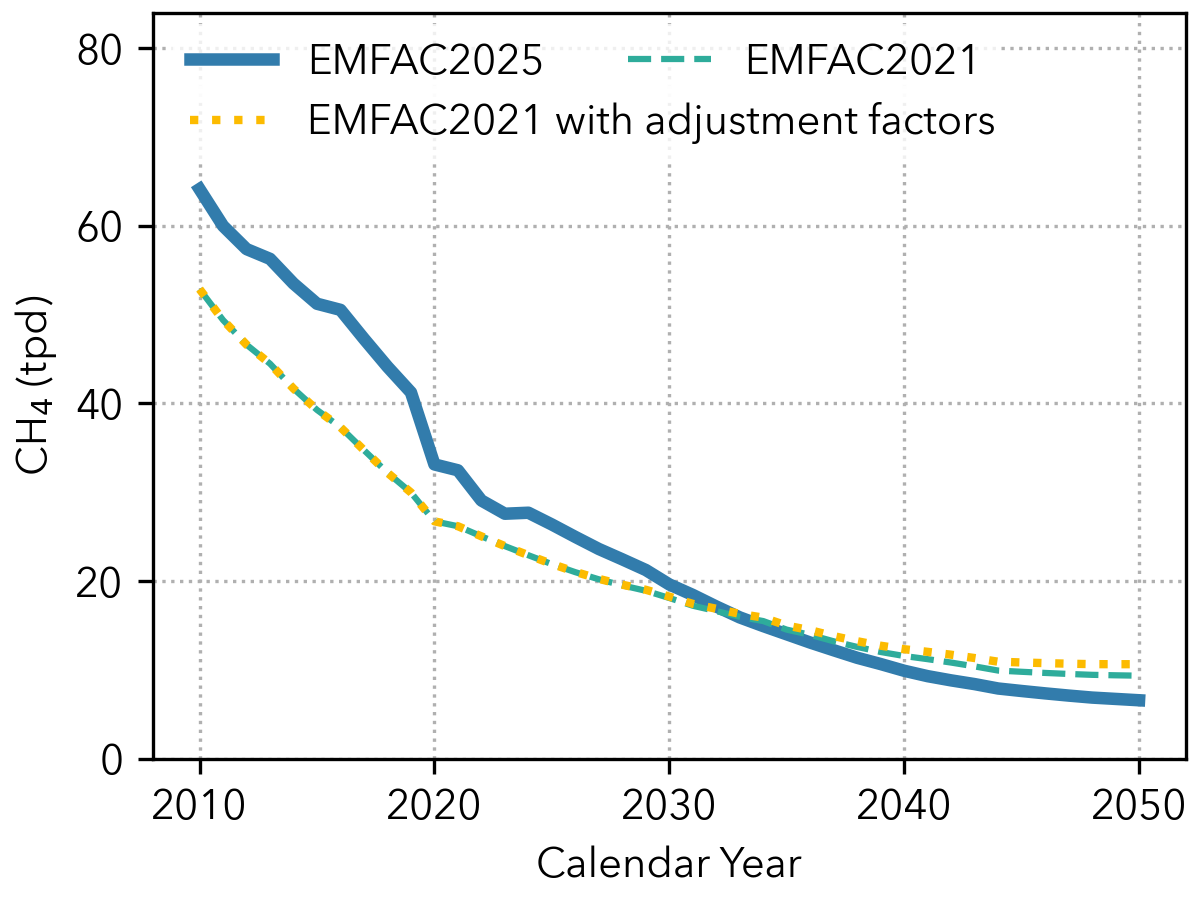
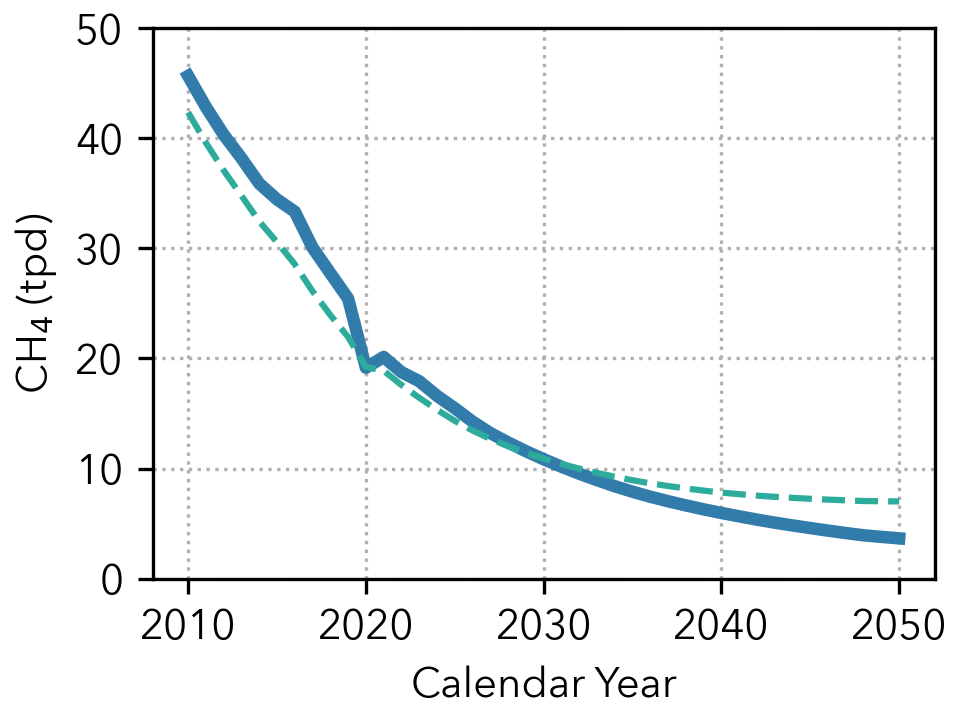
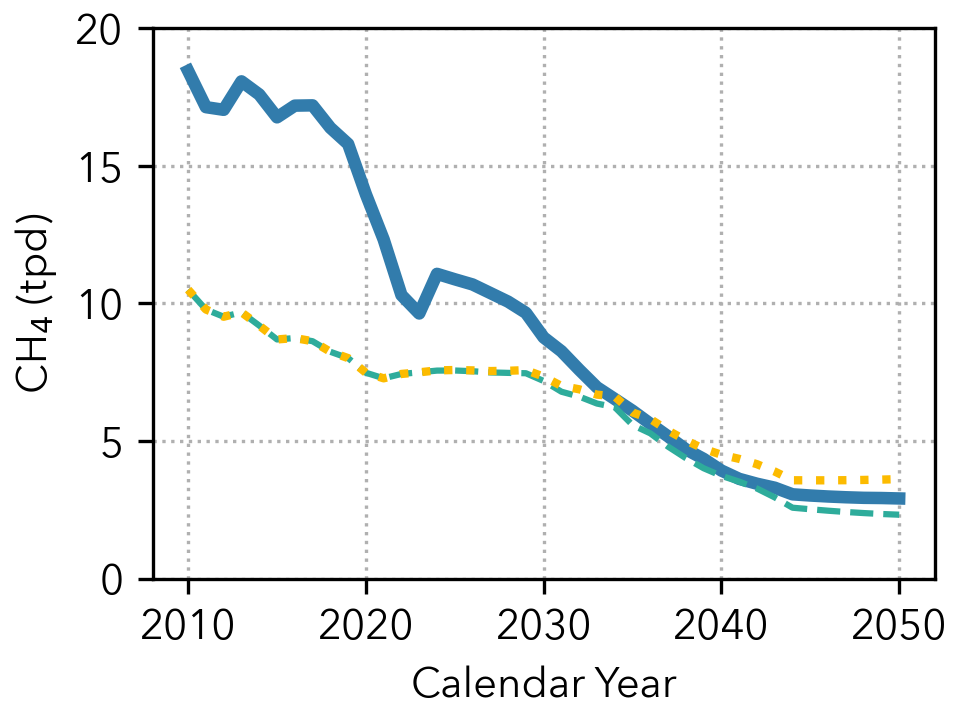
10.3.10. Methane (CH4)#
Figure 10.14 compares statewide CH4 emissions (tons/day) from 2010 to 2050. CH4 trends are driven primarily by heavy-duty fleet updates. Added CH4 crankcase emissions in heavy-duty NG trucks increase historical EMFAC2025 emissions relative to EMFAC2021. However, this update applies only to pre-2019 chassis trucks certified to 0.2 g/bhp NOx standard, so CH4 emissions in the heavy-duty fleet decline sharply after 2019.
 All Vehicles
 Light-Duty (GVWR ≤ 8,000 lbs.)
 Medium- and Heavy-Duty (GVWR > 8,000 lbs.)
Figure 10.14: Statewide CH4 Emissions: EMFAC2025 vs. EMFAC2021#