7.1. Reid Vapor Pressure Update#
Reid vapor pressure (RVP) is a measure of the evaporation rate, or the volatility of gasoline, typically expressed in pounds per square inch (psi). Gasoline with higher RVP — and thus higher volatility — evaporates faster than gasoline with lower RVP at a given temperature. During winter months, higher-RVP blends of gasoline are used to promote better fuel-air mixing, aiding cold engine starts. However, to mitigate evaporative hydrocarbon emissions, CARB implemented California Phase 3 Gasoline Regulations in 2007, setting the RVP limit to 7.0 psi for oxygenated fuels and 6.9 psi for non-oxygenated fuels during summer months (CARB, 2023). It is important to note that RVP affects only evaporative emissions and not exhaust emissions.
To comply with emission targets, refineries across California switch to producing summer blend gasoline in the spring and winter blend gasoline in the fall. This seasonal switch changes the RVP of California’s gasoline. California is divided into five fuel control regions, as shown in Figure 7.1. These regions represent groupings of air basins or geographic areas that follow the same transition schedules for switching between summer and winter fuel blends.
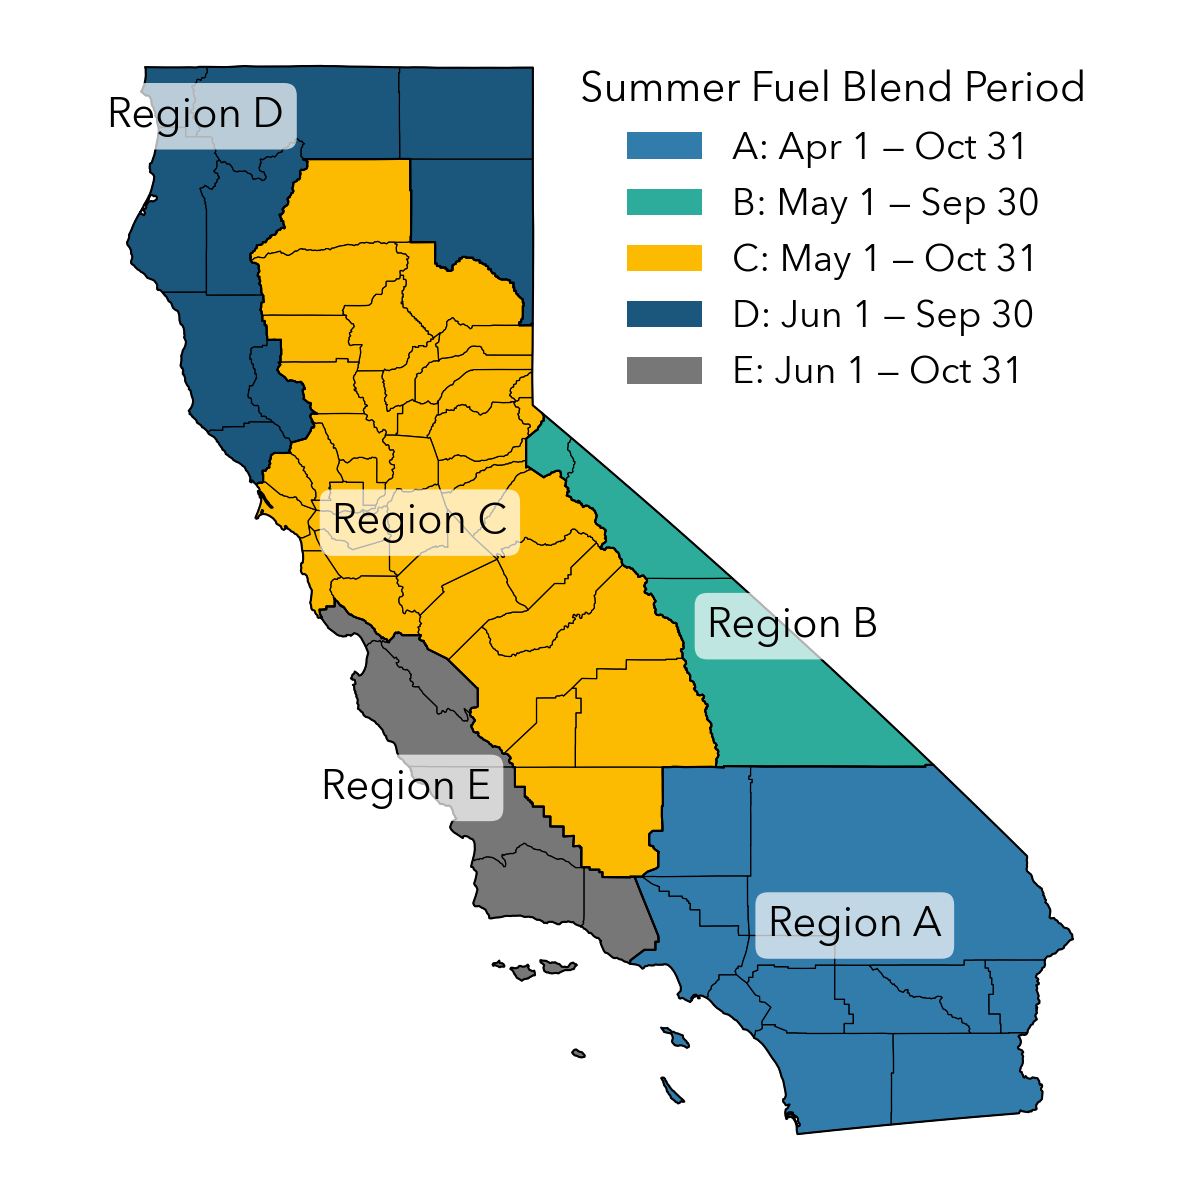
Figure 7.1: California Reid Vapor Pressure (RVP) Control Regions. The date ranges shown in the legend represent the summer fuel blend periods for each region.#
In the EMFAC model, RVP values serve as input parameters for calculating evaporative emissions, which vary by month and by air basin. These values were last comprehensively updated in EMFAC2002. For EMFAC2025, CARB has updated these values using data from recent field studies to better reflect current fuel formulations in use across California. Between 2008 and 2022, CARB’s Enforcement Division collected about 15,750 data points on the RVP content of gasoline from a range of sources, including service stations, terminals, and refineries. For the EMFAC2025 update, about 6,400 data points from service stations were selected to represent real-world fuel characteristics encountered by vehicles in operation.
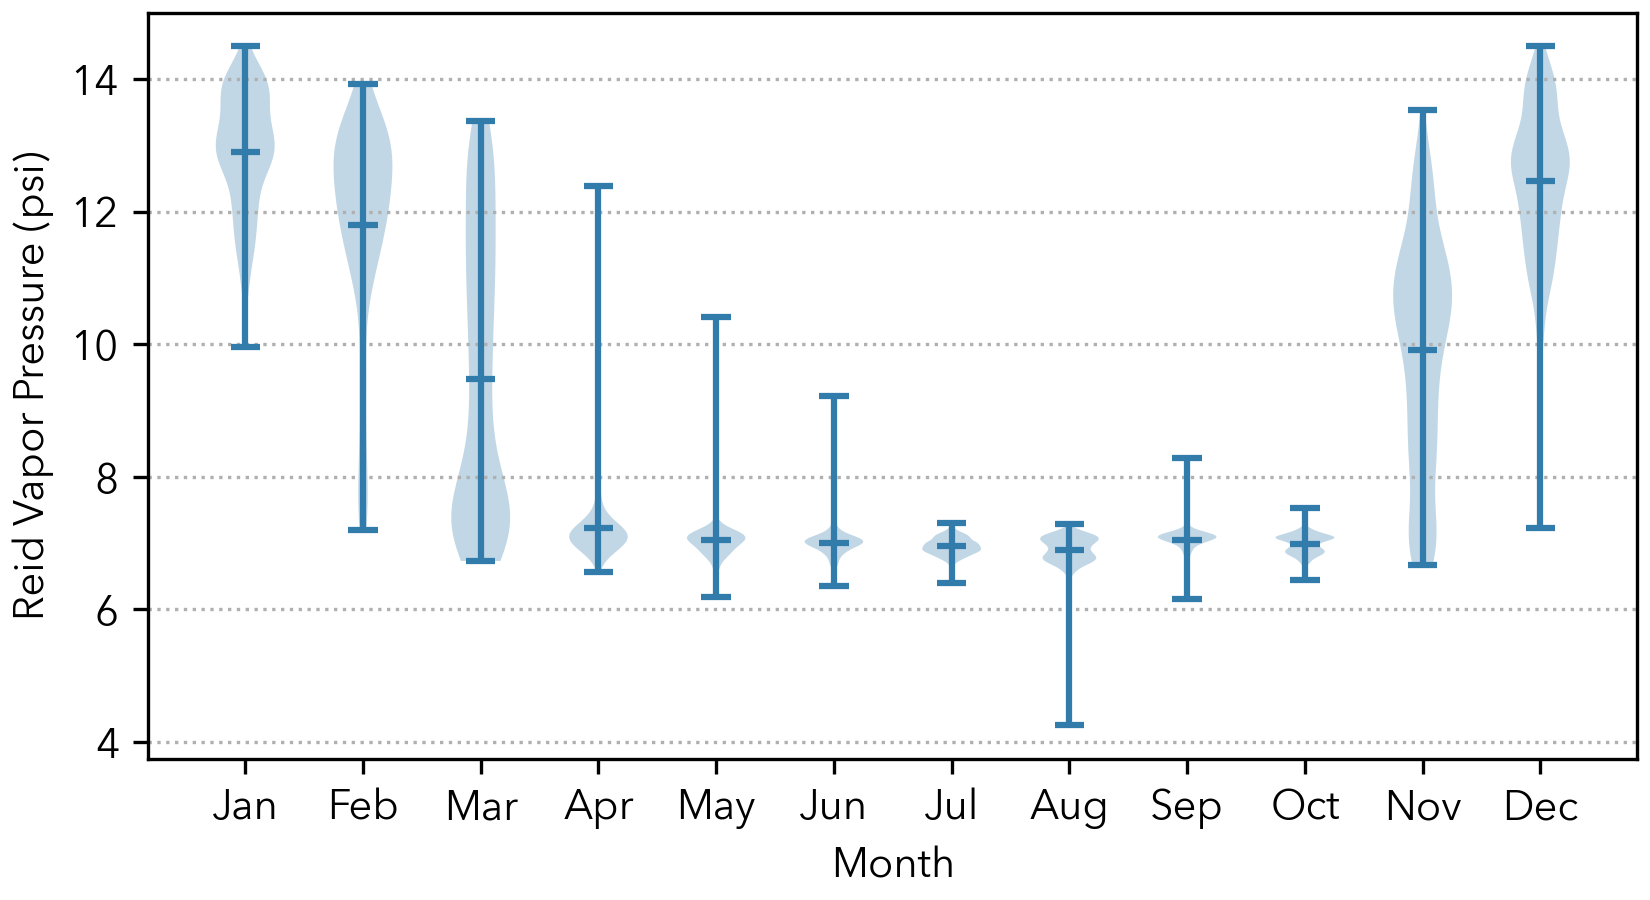
Figure 7.2: Statewide Reid Vapor Pressure (RVP) Data Collected by CARB. The top and bottom lines indicate the range of data, and the middle lines indicate mean values.#
To observe seasonal trends, the collected RVP data were plotted across all months in Figure 7.2. In particular, data for the winter months reveal that RVP values typically exceed 8 psi, which confirms the expected characteristics of winter fuel blends in California. During summer months, RVP values were consistently observed in the range of 6.40 to 7.20 psi. This aligns with regulatory requirements that limit RVP to 7 psi during the ozone season to control evaporative emissions. To derive monthly RVP values by control region for EMFAC2025, the following steps were applied:
Monthly averages were calculated using available service station data for each control region.
If data for a specific month and region were missing, values were estimated by averaging RVP from neighboring regions.
In cases where data for two consecutive months were missing, values were interpolated from the surrounding months with available data.
The finalized monthly RVP values were then mapped to individual Geographic Area Indexes (GAI) based on their corresponding control regions and updated in EMFAC.
Figure 7.3 through Figure 7.7 compare the RVP values used in EMFAC2021 with those updated for EMFAC2025 for each control region.
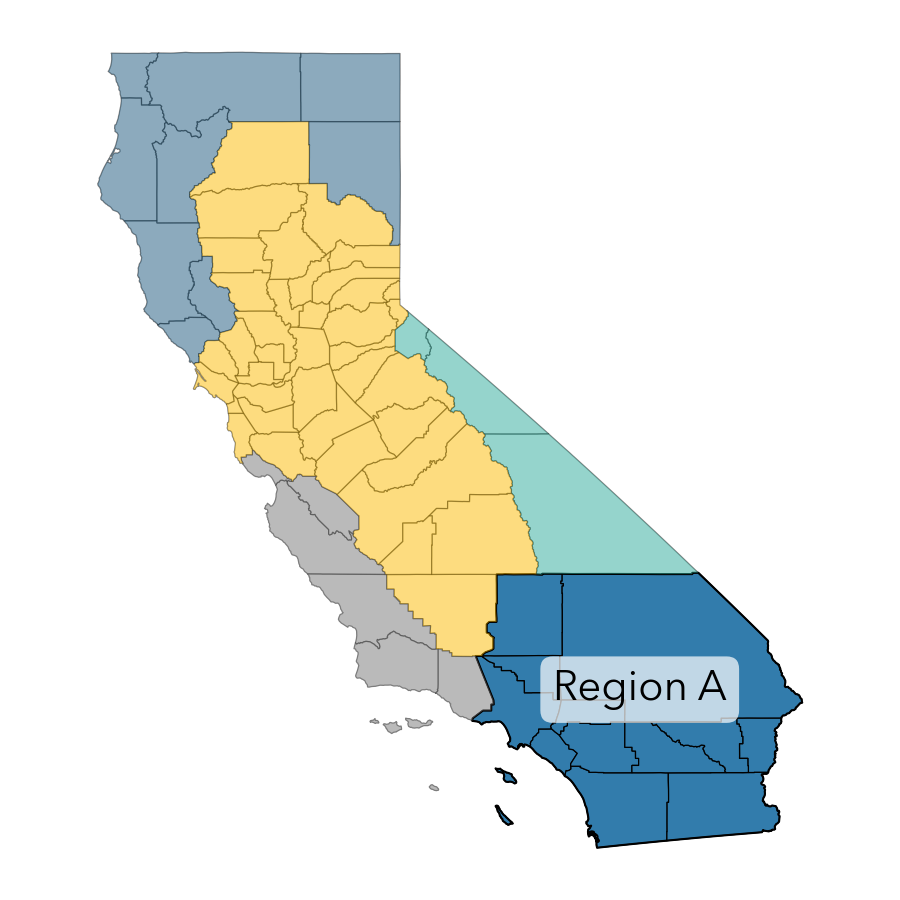 Control Region A
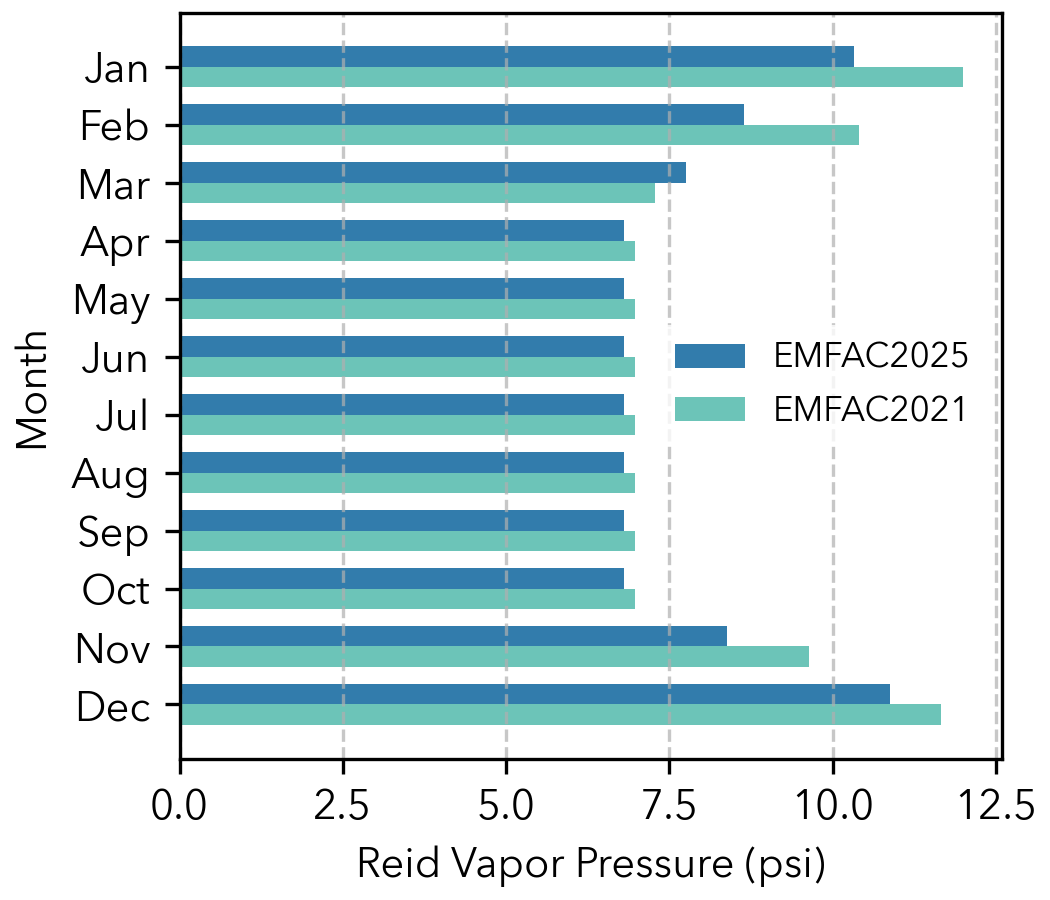 Monthly Reid Vapor Pressure of Region A
Figure 7.3: Updated Reid Vapor Pressure for Control Region A#
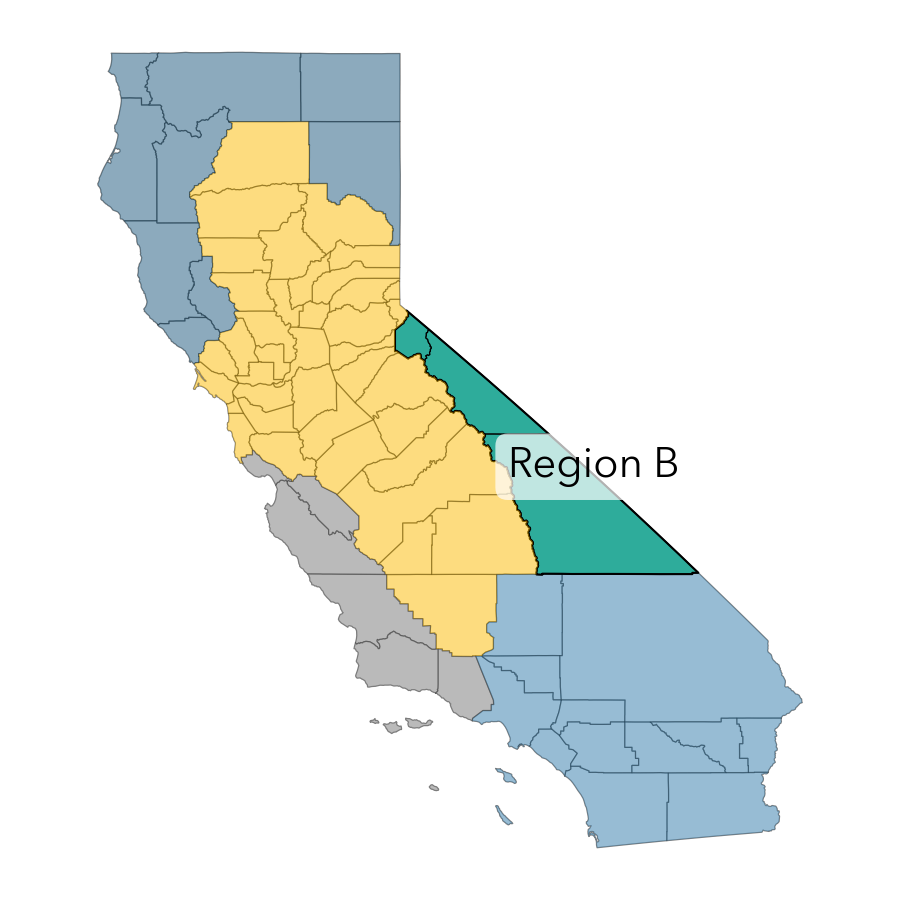 Control Region B
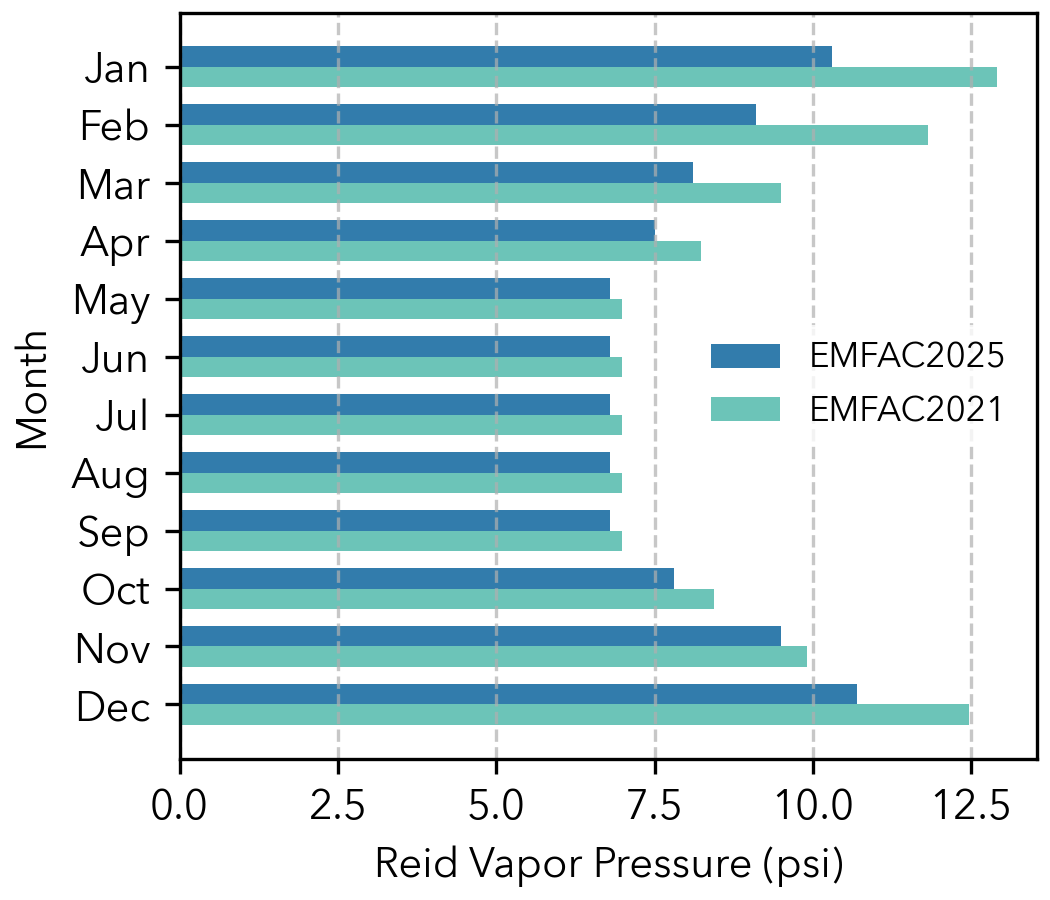 Monthly Reid Vapor Pressure of Region B
Figure 7.4: Updated Reid Vapor Pressure for Control Region B#
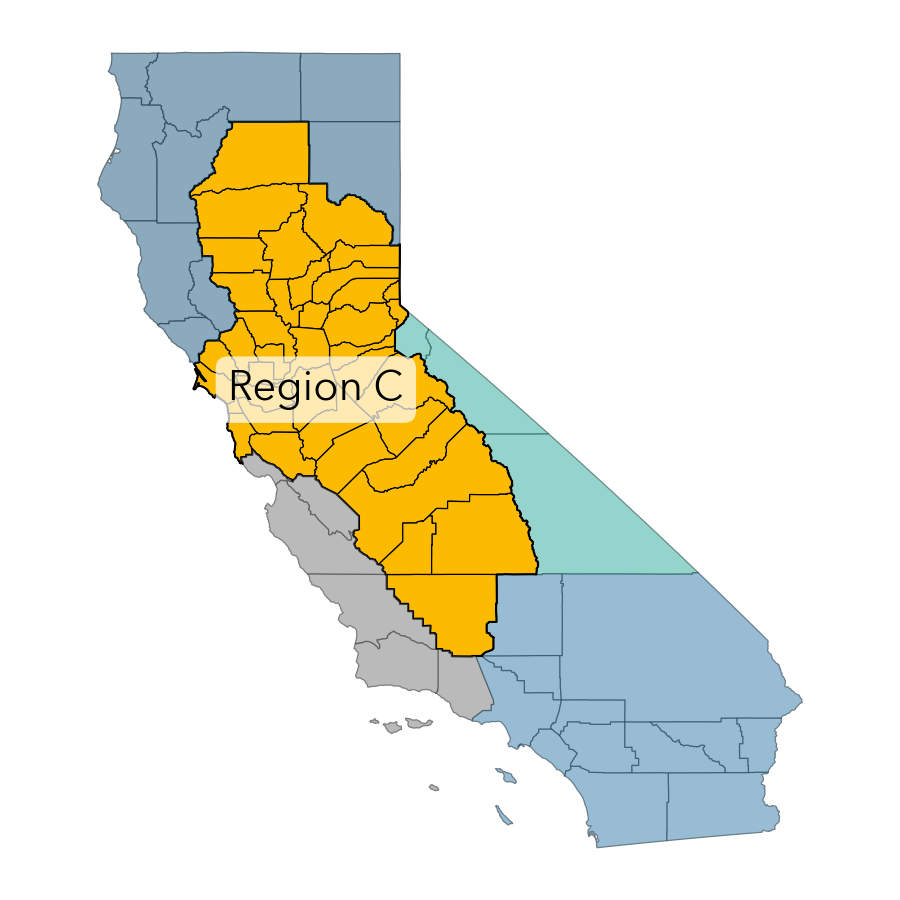 Control Region C
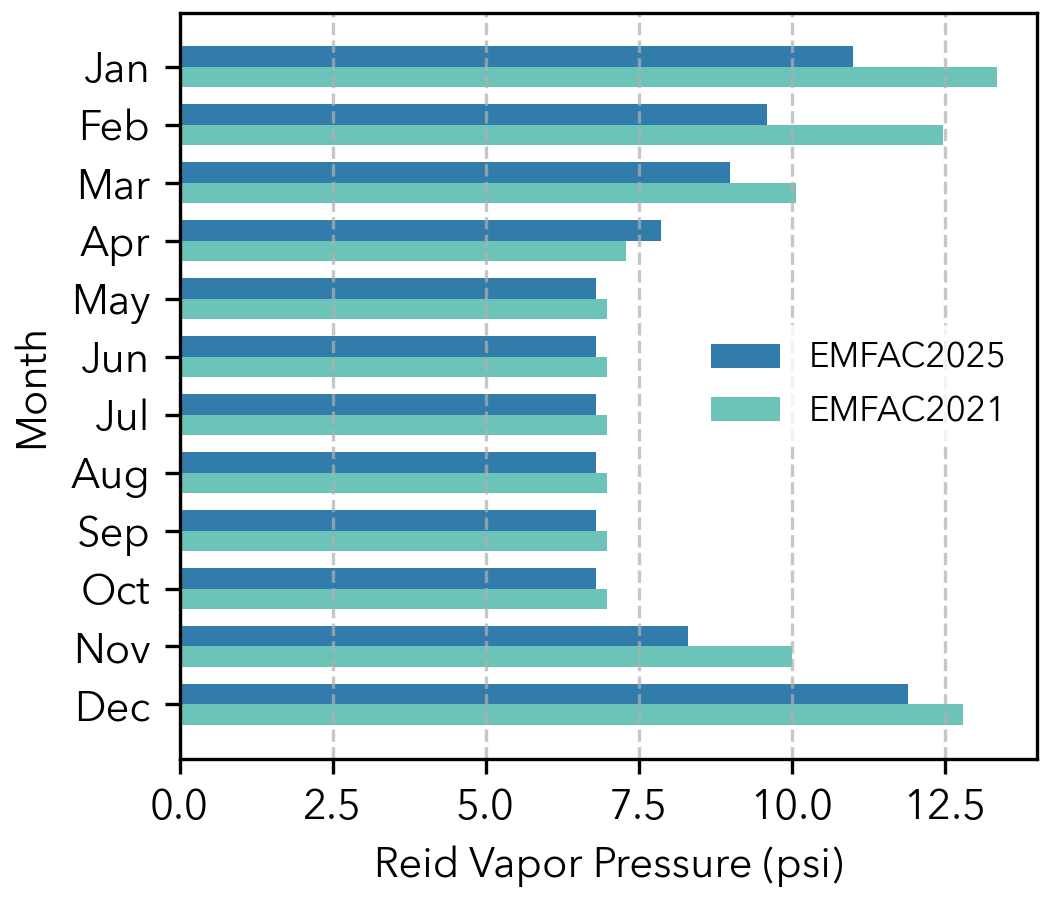 Monthly Reid Vapor Pressure of Region C
Figure 7.5: Updated Reid Vapor Pressure for Control Region C#
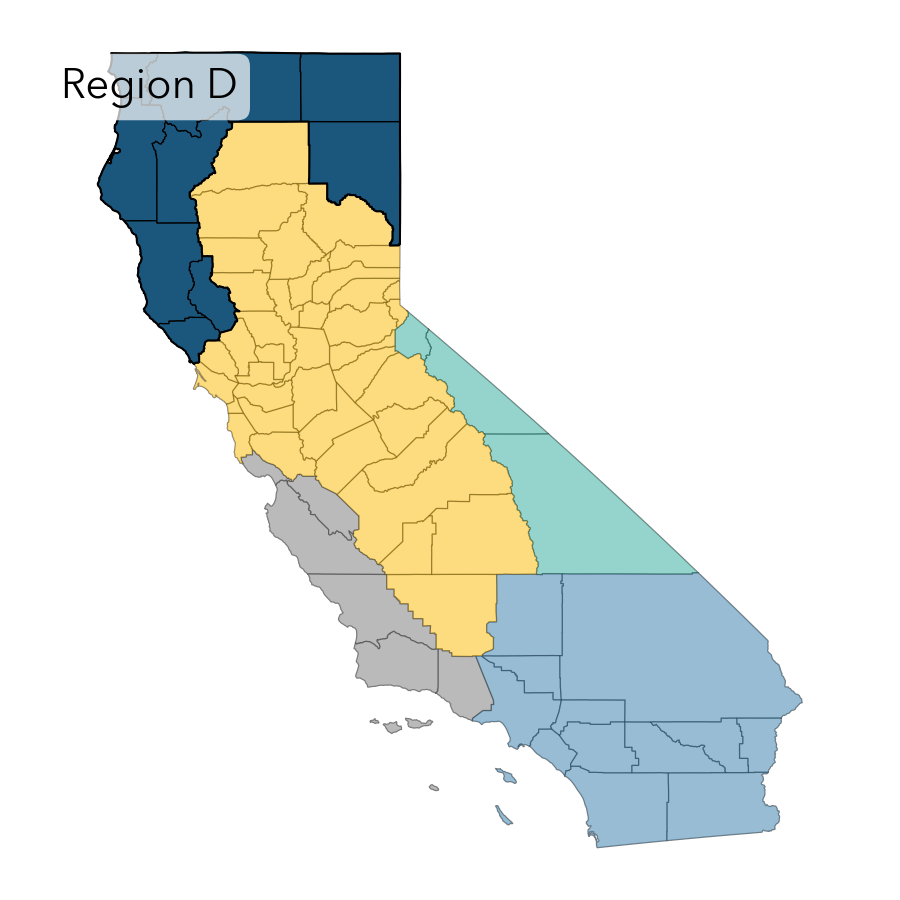 Control Region D
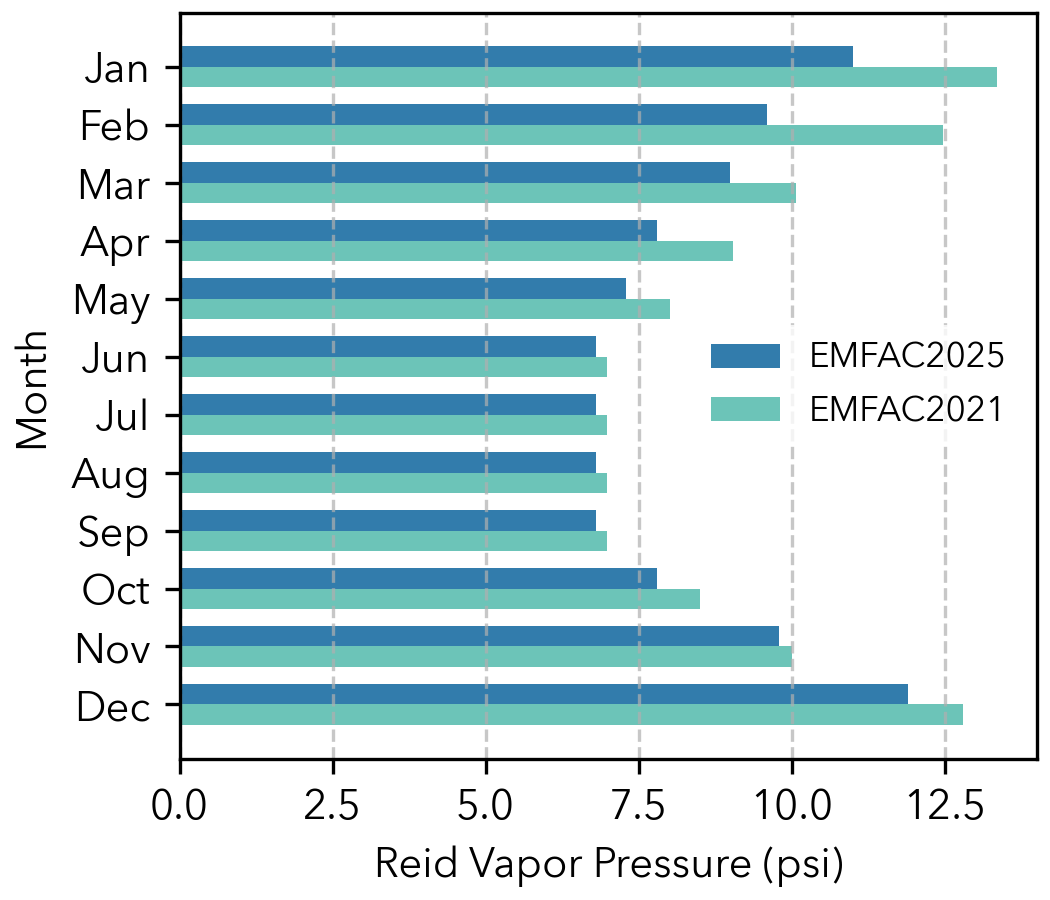 Monthly Reid Vapor Pressure of Region D
Figure 7.6: Updated Reid Vapor Pressure for Control Region D#
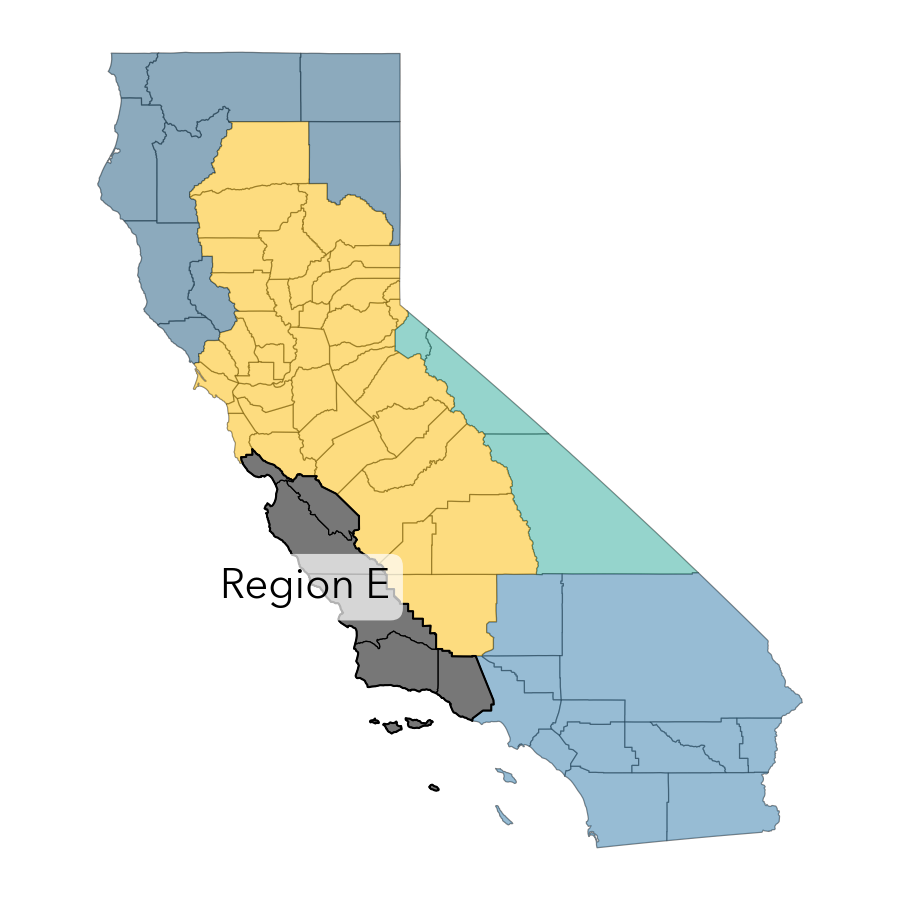 Control Region E
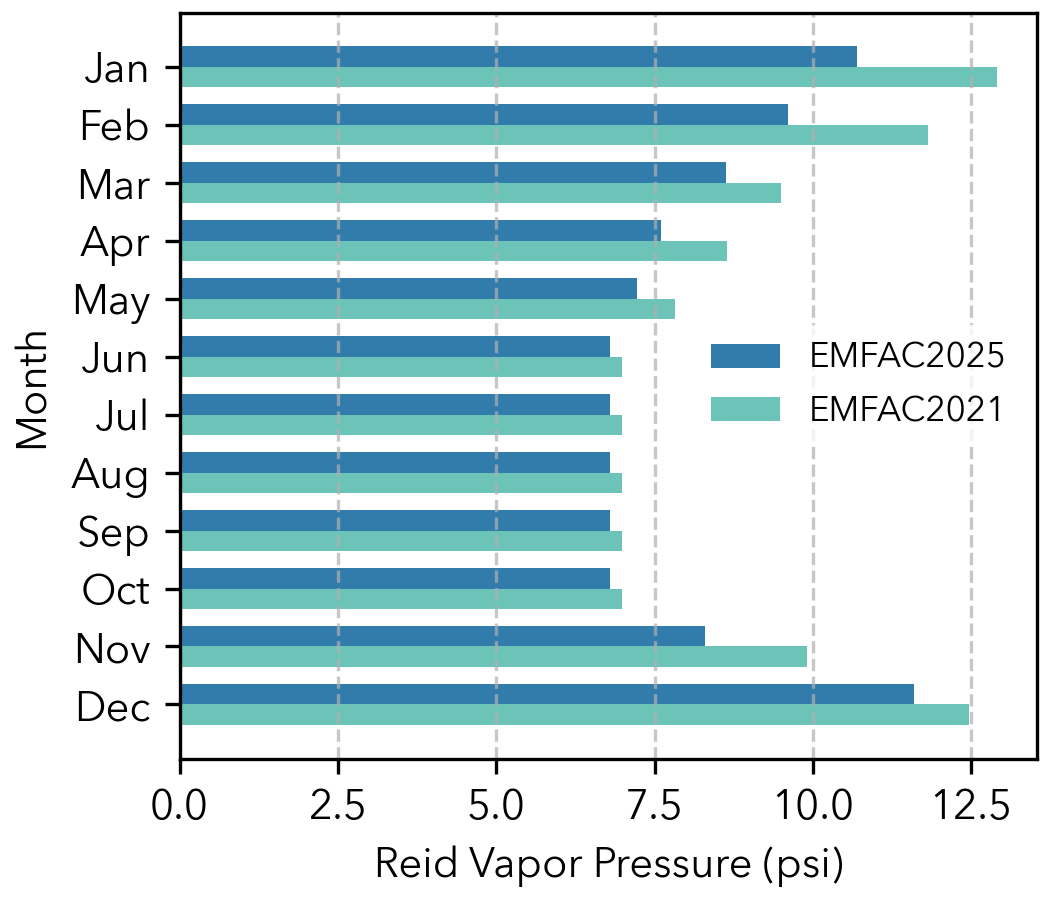 Monthly Reid Vapor Pressure of Region E
Figure 7.7: Updated Reid Vapor Pressure for Control Region E#