5.4. Natural Gas Heavy-Duty Vehicles#
This section describes updates to emission rates of NOx and CH4 for natural gas (NG) heavy-duty vehicles (HDV). EMFAC2025 updates the NOx emission rates for NG HDVs using Portable Emissions Measurement Systems (PEMS) data. Although this dataset was already used to calculate NG HDV emission rates in EMFAC2021, this update reanalyzes the dataset to apply a new binning method and incorporate additional test data that became available after EMFAC2021 was completed. These updates only apply to running exhaust emissions of NOx. Additionally, for model year 2017 and earlier model years, EMFAC2025 updates methane emissions from blow-by processes in open crankcase NG engines. Emission rates of other pollutants/processes are unaffected.
5.4.1. PEMS Dataset#
A multiagency-funded 200-vehicle study (Leonard et al., 2023) collected on-road observations of emissions from heavy duty vehicles using PEMS. PEMS testing included nearly one hundred heavy-duty vehicles and about half of these were natural gas (NG) vehicles. Each test vehicle was instrumented with a PEMS unit that continuously measured the vehicle’s emissions of gaseous pollutants for a typical day of operation. For this analysis, PEMS data from 50 NG heavy-duty vehicles were obtained covering four vocation categories and two NOx engine certification standards (0.2 g/bhp-hr and 0.02 g/bhp-hr, Table 5.7). The NOx certification standards are expressed in units of grams of NOx emitted per brake horsepower-hour (g/bhp-hr), which represents the amount of NOx produced per unit of net engine power output over time. For implementation in EMFAC, vehicles certified to the 0.2 g/bhp-hr engine NOx standard were assumed to represent model years 2007–2017 while vehicles certified to the 0.02 g/bhp-hr engine NOx standard were assumed to represent model years 2018 and later. This dataset was previously used in EMFAC2021 but was re-analyzed for EMFAC2025 using an improved data binning approach and three newly available vehicle test datasets. This PEMS analysis was used solely to update NOx emission rates of NG HDVs, not for other pollutants.
Vocation |
Technology |
Number of Vehicles |
||
|---|---|---|---|---|
EMFAC2021 |
EMFAC2025 |
|||
Transit Buses |
CNG 0.2 g/bhp-hr |
5 |
4 |
|
CNG 0.02 g/bhp-hr |
5 |
5 |
||
School Buses |
CNG 0.2 g/bhp-hr |
5 |
5 |
|
CNG 0.02 g/bhp-hr |
0 |
0 |
||
Refuse Trucks |
CNG 0.2 g/bhp-hr |
11 |
10 |
|
CNG 0.02 g/bhp-hr |
1 |
4 |
||
Goods Movement Trucks |
CNG 0.2 g/bhp-hr |
8 |
8 |
|
CNG 0.02 g/bhp-hr |
9 |
11 |
||
Delivery Trucks |
CNG 0.2 g/bhp-hr |
3 |
3 |
|
CNG 0.02 g/bhp-hr |
0 |
0 |
||
Total |
47 |
50 |
||
Staff note that the 50 vehicles analyzed for EMFAC2025 differ from the dataset of 47 vehicles that were used for EMFAC2021 (Table 5.7). This is because additional test data became available for five NG vehicles since the original analysis. Additionally, data from two previously used vehicles were excluded from the study’s final dataset.
There were five vocation categories defined in the 200-vehicle study: transit buses, school buses, refuse trucks, goods movement trucks, and delivery trucks. However, since EMFAC does not have a goods movement category or a delivery truck category, these two categories were grouped together and used to characterize emission rates for all other heavy-duty trucks.
As each PEMS test in the 200-vehicle study captured emissions under a typical working day, staff treat each vocation separately, as they have distinct speeds, loads, and driving practices depending on their operational routines. For each vocation/technology group, staff calculate a base emission rate (BER), using the cycle speed of a dynamometer test cycle commonly used for that vocation. Then, staff estimate speed correction factors relative to that cycle speed. Table 5.8 lists the test cycles chosen for the four NG vehicle categories, and the cycle speed that represents the BERs.
Transit Bus |
School Bus |
Refuse Truck |
Other HDVs* |
|
|---|---|---|---|---|
Standard Cycle |
OCBC |
AQMD-SB |
AQMD RTC |
UDDS |
Average Cycle Speed (mph) |
12.1 |
12.3 |
7.31 |
18.8 |
\(^*\)Other HDVs includes all vehicles classified as goods movement or delivery trucks in the 200-vehicle study
5.4.2. Base Emission Rates#
Previously, in EMFAC2021, CARB staff grouped the PEMS data into 10 mph speed bins based on the vehicle’s instantaneous speed. For example, all data points where the instantaneous speed fell between 0–10 mph were averaged together to represent emission rates at that speed bin. However, there were two concerns with this approach: (1) that the second-by-second data can be noisy, and (2) that speed effects on emission rates are not instantaneous. Emission rates are not only dependent on the vehicle speed at a given moment, but on the driving conditions for some time before. This is a resultant of changes to the catalyst temperature and performance based on accelerating/braking, which may include lagged effects.
To account for this, CARB staff updated the binning methodology in EMFAC2025, following a similar data processing approach as for diesel HDVs (Section 5.1.2). The new approach involves grouping the data points into segments of driving conditions called microtrips. Microtrips are short trips (less than 3 miles) defined from start to stop. These driving segments better represent the impacts of driving conditions on emissions compared to using the instantaneous speed.
To segment the data into microtrips, CARB staff first remove observations with nonsensical, negative or null values. Non-continuous data points where there was a time gap greater than 1 second between consecutive observations were also excluded. To keep the BERs representative of running exhaust emissions, all idling events were excluded. Idling events were defined as periods when the vehicle traveled less than one mile within five minutes and the instantaneous speed never exceeded 5 mph. Then, CARB staff iterate through each vehicle’s test data chronologically, checking the vehicle speed and calculating the cumulative distance traveled over time. Whenever the vehicle reaches a speed of 0 mph, CARB staff create a break in the data and a new microtrip begins. Consecutive microtrips shorter than 0.25 miles are grouped together. If the cumulative distance traveled exceeds 3 miles, CARB staff end the microtrip and start a new one.
Once the data is segmented into microtrips, CARB staff calculate the average speed, the cumulative distance traveled, and the cumulative NOx emitted for each microtrip. The emission rate (in g/mi) is determined by dividing the total NOx emissions by the total distance traveled during each microtrip. These emission rates were then grouped into speed bins using 5 mph intervals, and each speed bin was represented by its midpoint (e.g., 7.5 mph for the 5–10 mph bin). For each vehicle, CARB staff fitted a power function to the speed-binned data to model NOx emission rates as a function of speed. An example power fit result for one vehicle is shown in Figure 5.9. CARB staff solve each vehicle’s power function for its respective cycle speed (Table 5.8) to estimate its base emission rate. Finally, CARB staff average the base emission rates for each vocation/technology group. The resulting BERs for all vocation/technology groups are presented in Figure 5.10 and Table 5.9.
Test data for 0.02 g/bhp-hr school buses was not available. Thus, CARB staff estimate the BER for this technology group using the ratio of 0.02 to 0.2 BERs from transit buses. For transit buses, the ratio of 0.02-g to 0.2-g emission rates was 0.20. Multiplying this by the BER of 0.2-g school buses results in a BER of 0.265.
NOx Base Emission Rate (g/mi) |
|||
|---|---|---|---|
EMFAC2021 |
EMFAC2025 |
||
Refuse |
CNG 0.2 g/bhp-hr |
7.90 |
6.95 |
CNG 0.02 g/bhp-hr |
0.17 |
1.00 |
|
School Bus |
CNG 0.2 g/bhp-hr |
2.23 |
1.36 |
CNG 0.02 g/bhp-hr |
0.36 |
0.27 |
|
Transit Bus |
CNG 0.2 g/bhp-hr |
1.44 |
0.82 |
CNG 0.02 g/bhp-hr |
0.23 |
0.16 |
|
HD Truck |
CNG 0.2 g/bhp-hr |
1.28 |
1.28 |
CNG 0.02 g/bhp-hr |
0.24 |
0.26 |
|
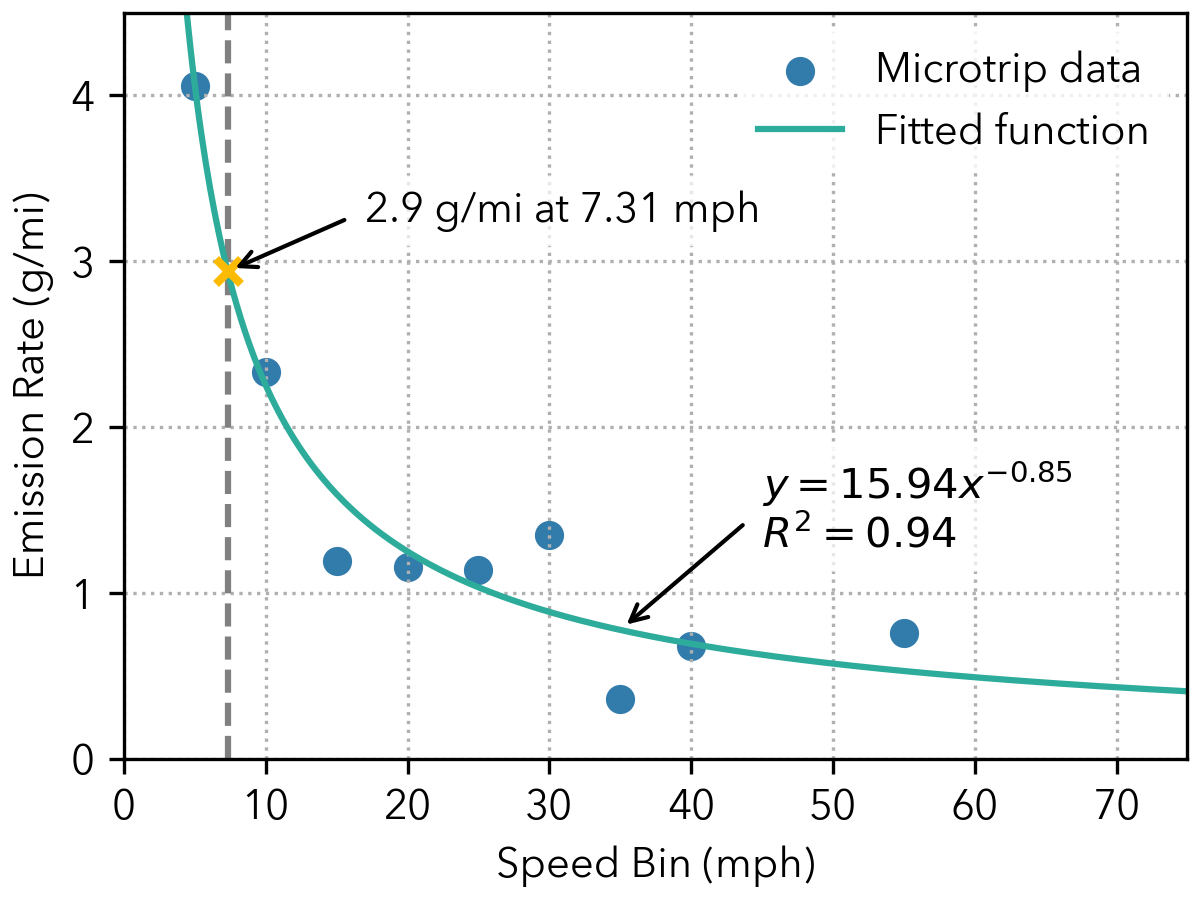
Figure 5.9: Example of a Power Function Fit Used to Calculate Base Emission Rates for a PEMS-Tested Refuse Hauler Certified to CNG 0.2 g/bhp-hr#
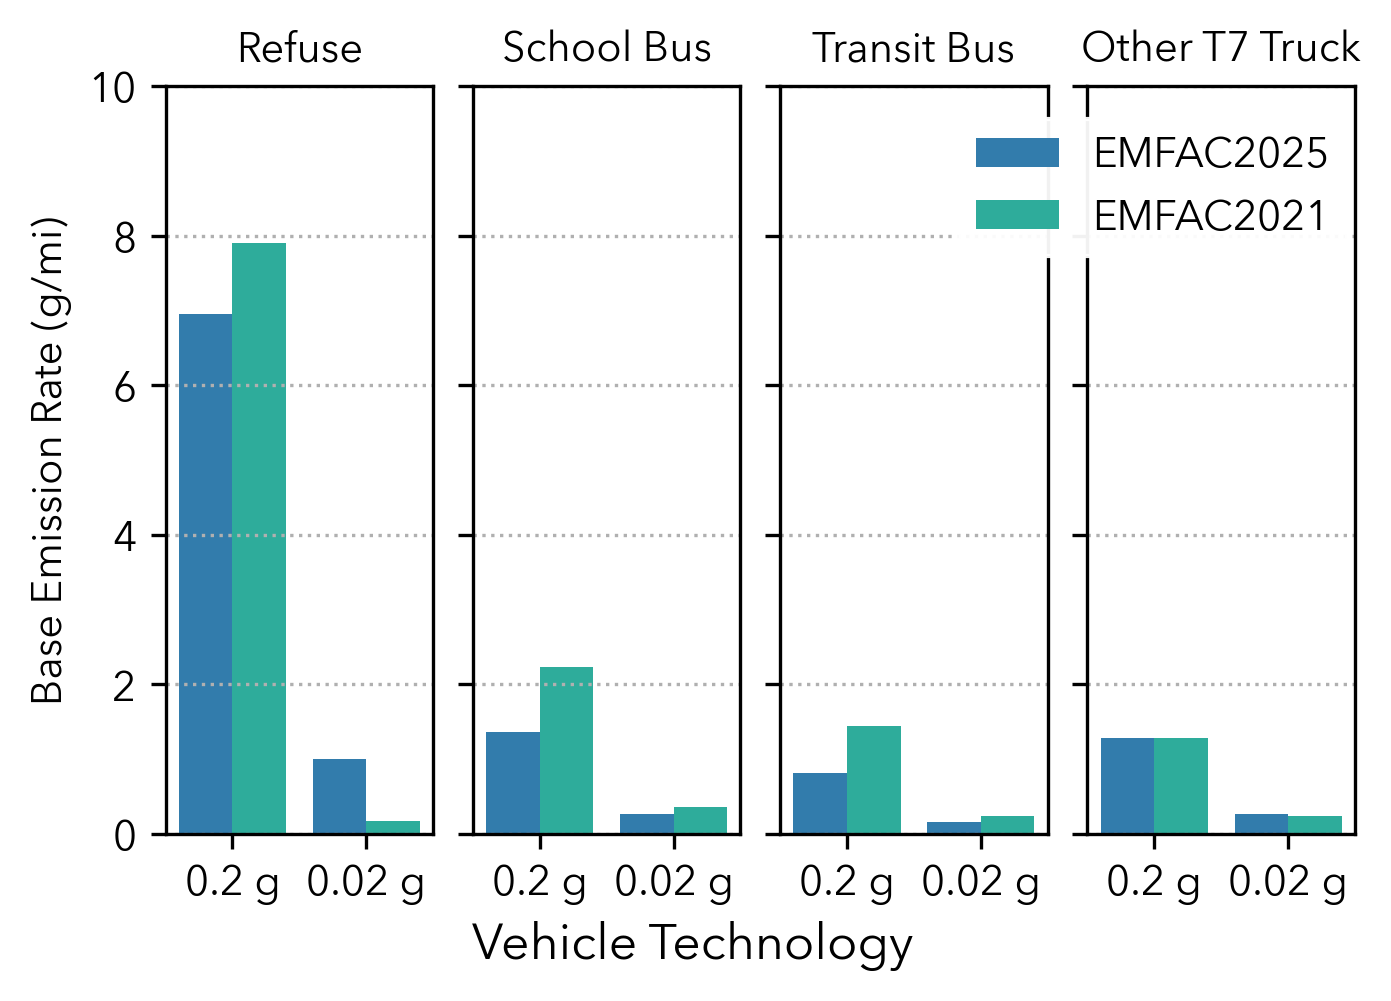
Figure 5.10: Updated NOx Base Emission Rates for Natural Gas Heavy-Duty Vehicles#
5.4.3. Medium Heavy-Duty Vehicles#
The 200-vehicle study did not conduct any PEMS tests on medium-heavy duty (T6) natural gas vehicles. Thus, to estimate base emission rates for T6 NG vehicles, CARB staff apply a ratio based on the emission rates of diesel heavy-duty trucks. The ratio of emission rates between medium and heavy heavy-duty (T7) diesel trucks was 0.21, as described in Section 5.2. Thus, CARB staff multiply the BERs of T7 NG trucks by this scalar to calculate the BERs of T6 vehicles. Results are shown in Table 5.10.
Vocation |
Technology |
NOx BER (g/mi) |
|---|---|---|
T6 Transit Buses |
CNG 0.2 g/bhp-hr |
0.241 |
CNG 0.02 g/bhp-hr |
0.047 |
|
All Other T6 Vehicles |
CNG 0.2 g/bhp-hr |
0.269 |
CNG 0.02 g/bhp-hr |
0.056 |
Similarly, T6 transit buses did not have PEMS data, so CARB staff estimated their BERs using a scalar approach. CARB staff first applied the T6/T7 ratio of 0.21. However, since this T6/T7 ratio is defined for the UDDS cycle speed of 18.8 mph, CARB staff further corrected the BER to represent the 12.1 mph speed that is used for transit buses. To do so, CARB staff use the ratio of the speed correction factors for T6 diesel trucks at 12.1 mph divided by the SCF at 18.8 mph. The resulting scalar is 1.3935. The resulting BERs after applying these two scalars, are presented in Table 5.10.
Refuse trucks and school buses do not have a T6 equivalent in EMFAC.
5.4.4. Speed Correction Factors#
Once the BERs are known for each vocation/technology group, CARB staff calculate speed correction factors (SCF) to account for the variation in emission rates at different speeds.
To determine the SCFs, CARB staff start with the vehicle-by-vehicle, speed-binned emission rates that were calculated from the microtrips analysis. CARB staff group the vehicles by their vocation and technology group (e.g., refuse trucks certified to CNG 0.02 g/bhp-hr). CARB staff normalize all points by the BER for that vocation/technology group (shown in Figure 5.10). This defines the SCF as equal to 1 at the cycle speed at which the BER was calculated. CARB staff then fit a line through the points that represents the trend. In general, a power function represented the data well for all vehicle groups, leading to SCFs > 1 for speeds below the BER speed, and SCFs < 1 at faster speeds. In this step, six vehicles were excluded because they were determined to be outliers. An example curve fit is shown below in Figure 5.11.
Technology |
Model Years |
Speed Correction Factor Equation |
\(R^2\) |
|
|---|---|---|---|---|
Transit bus |
CNG 0.2 g |
2007–2017 |
\(21.29 \times (\text{Speed})^{-1.04}\) |
0.88 |
CNG 0.02 g |
2018+ |
\(2.55 \times (\text{Speed})^{-0.34}\) |
0.51 |
|
School bus |
CNG 0.2 g |
2007–2017 |
\(132.14 \times (\text{Speed})^{-2.02}\) |
0.96 |
CNG 0.02 g |
2018+ |
No test data |
n.a. |
|
Refuse trucks |
CNG 0.2 g |
2007–2017 |
\(6.52 \times (\text{Speed})^{-0.88}\) |
0.95 |
CNG 0.02 g |
2018+ |
\(2.06 \times (\text{Speed})^{-0.36}\) |
0.43 |
|
Other HDVs |
CNG 0.2 g |
2007–2017 |
\(4.54 \times (\text{Speed})^{-0.56}\) |
0.67 |
CNG 0.02 g |
2018+ |
\(7.75 \times (\text{Speed})^{-0.62}\) |
0.84 |
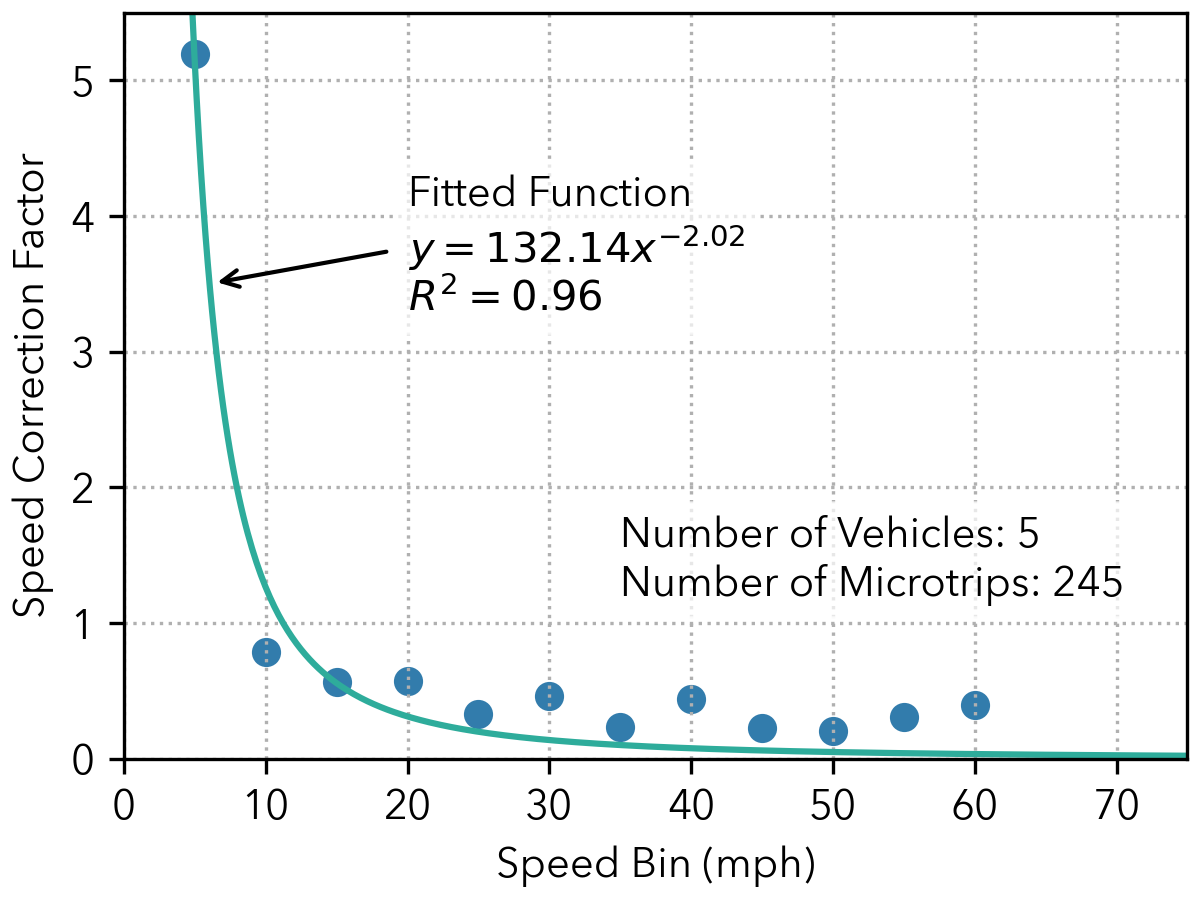
Figure 5.11: Example of a Power Function Fit Used to Calculate Speed Correction Factors for School Buses Certified to CNG 0.2 g/bhp-hr#
Table 5.11 and Figure 5.12 show the resulting SCF functions for all vehicle groups. Since there were very measurements for speeds above 55 mph, CARB staff use the SCF of the 55 mph speed bin for all higher speeds. Since PEMS data for CNG 0.02 g school buses was not available, CARB staff assume the same SCFs as for CNG 0.2 g school buses. Similarly, CARB staff use the same SCFs for T6 trucks as for T7 trucks due to lack of data.
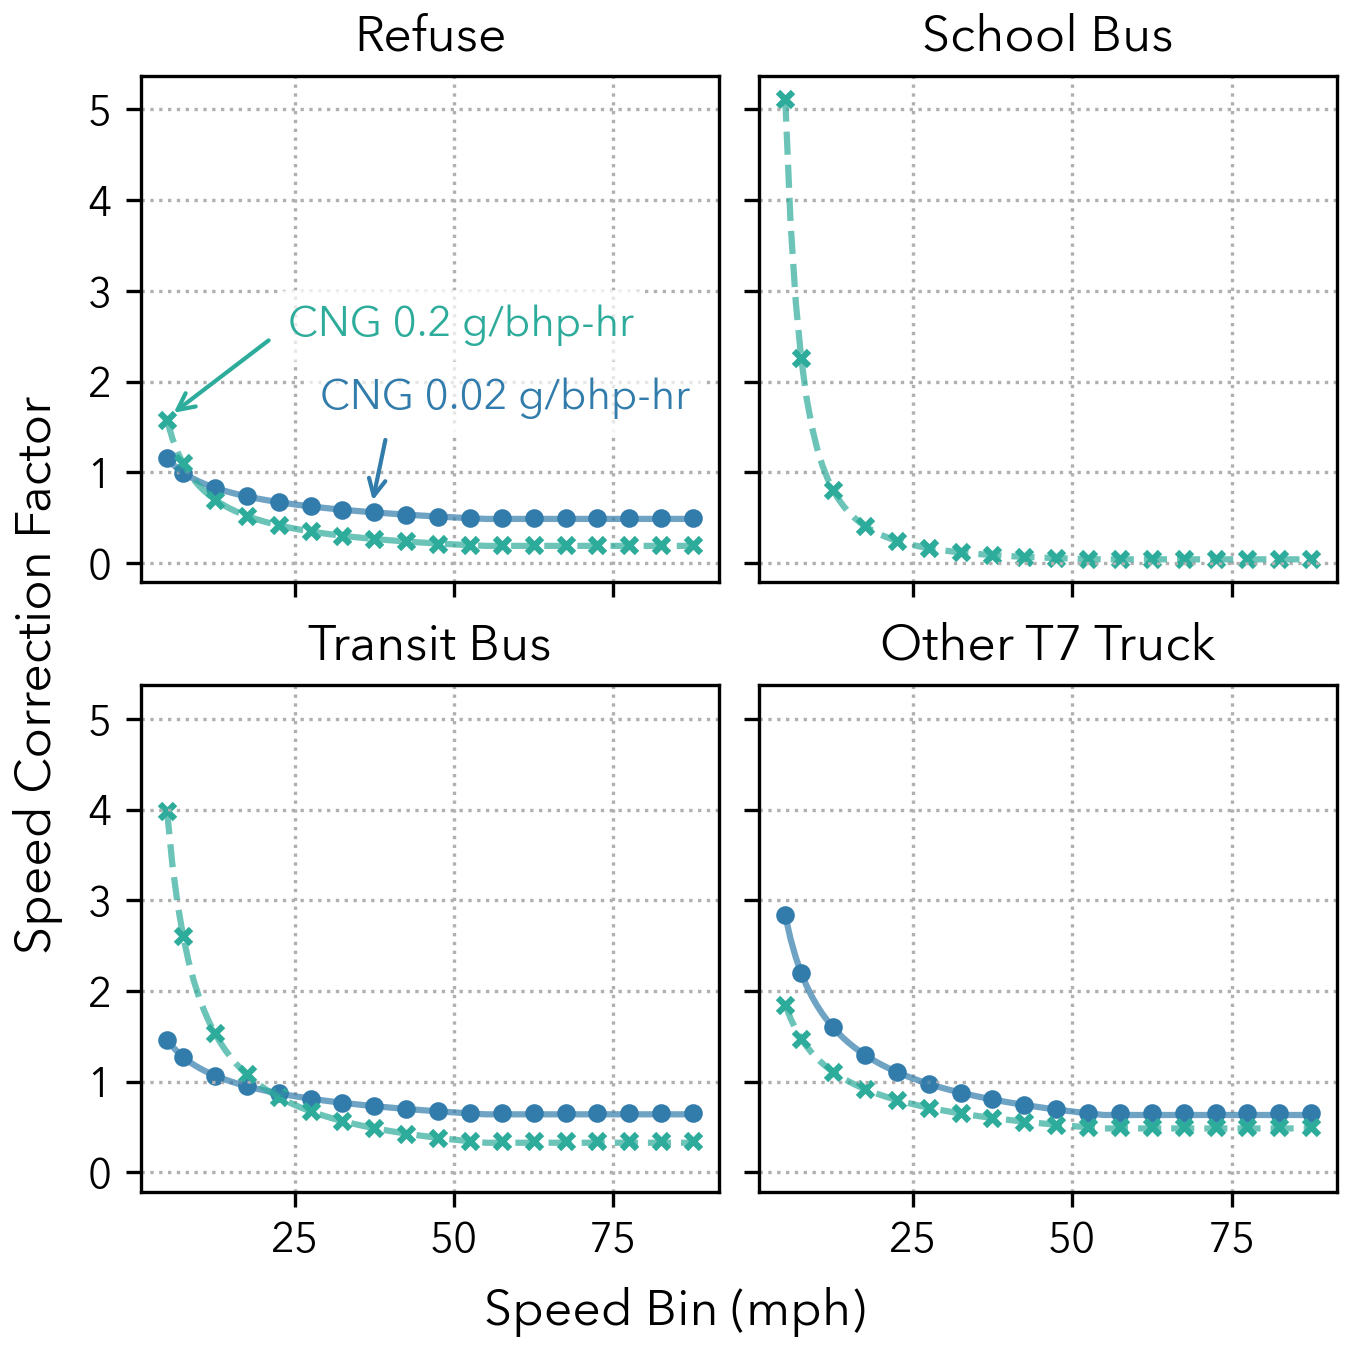
Figure 5.12: Speed Correction Factors for Natural Gas Heavy-Duty Vehicles#
5.4.5. Start Emissions#
For NG HDVs CARB staff decided not to estimate start emissions separately from running exhaust emissions. CARB staff initially attempted to define criteria to isolate start emissions similar to the new methodology used for diesel heavy-duty vehicles (Section 5.1.1). However, there appeared to be a negligible impact of start emissions on base emission rates results, regardless of the criteria used to isolate the start emissions. Other test studies also observed that the start period had a relatively low impact on total in-use NOx emissions for natural gas engines (Zhu et al., 2020). This is because the three-way catalysts (TWC) in these NG vehicles warm up and activate rather quickly (on the order of 100 seconds), leading to an overall small contribution of the start emissions period despite the higher NOx emission rate on a grams per bhp-hr basis. Compared to SCR technology in diesel engines, TWCs spend much less time at temperatures below 200 °C and are less sensitive to temperature fluctuations (Zhu et al., 2024, McCaffery et al., 2021). Thus, CARB staff decided to treat all the data together and implicitly account for NG HDV start emissions in running exhaust emissions.
5.4.6. Blow-by Emissions#
Blow-by processes emit pollutants in ways often not captured by tailpipe emissions. In a NG combustion chamber, methane can leak around the piston seals (“blow-by”) into the crankcase, and when the crankcase pressure accumulates, it vents into the atmosphere. Because EMFAC2021’s NG heavy-duty emissions factors are based on PEMS testing from the 200-vehicle study, which sampled from the tailpipe, blow-by emissions from NG vehicles were not measured. Blow-by emissions are only relevant for model year 2017 and earlier that were certified to the 0.2 g/bhp-hr NOx standard. For model year 2018 and later, the more stringent NOx standard led manufacturers to incorporate a closed-crankcase design, which circulates crankcase ventilation back into the engine intake.
Clark et al. (2016) shows that for heavy-duty NG trucks with an open-crankcase design, the methane emissions from the crankcase can be even greater than those from the tailpipe. Based on this publication, a 2.28 multiplier was added to NG methane emissions for all model year 2017 and earlier model years to account for blow-by processes in open crankcase engines.
Figure 5.13 shows a comparison between statewide EMFAC2021 and updated EMFAC2025 methane emissions from the on-road fleet. This update results in a 20% increase in methane emissions in calendar year 2025 but with a decreasing impact projected into the future as a greater proportion of the fleet turns over to model year 2018 and newer.
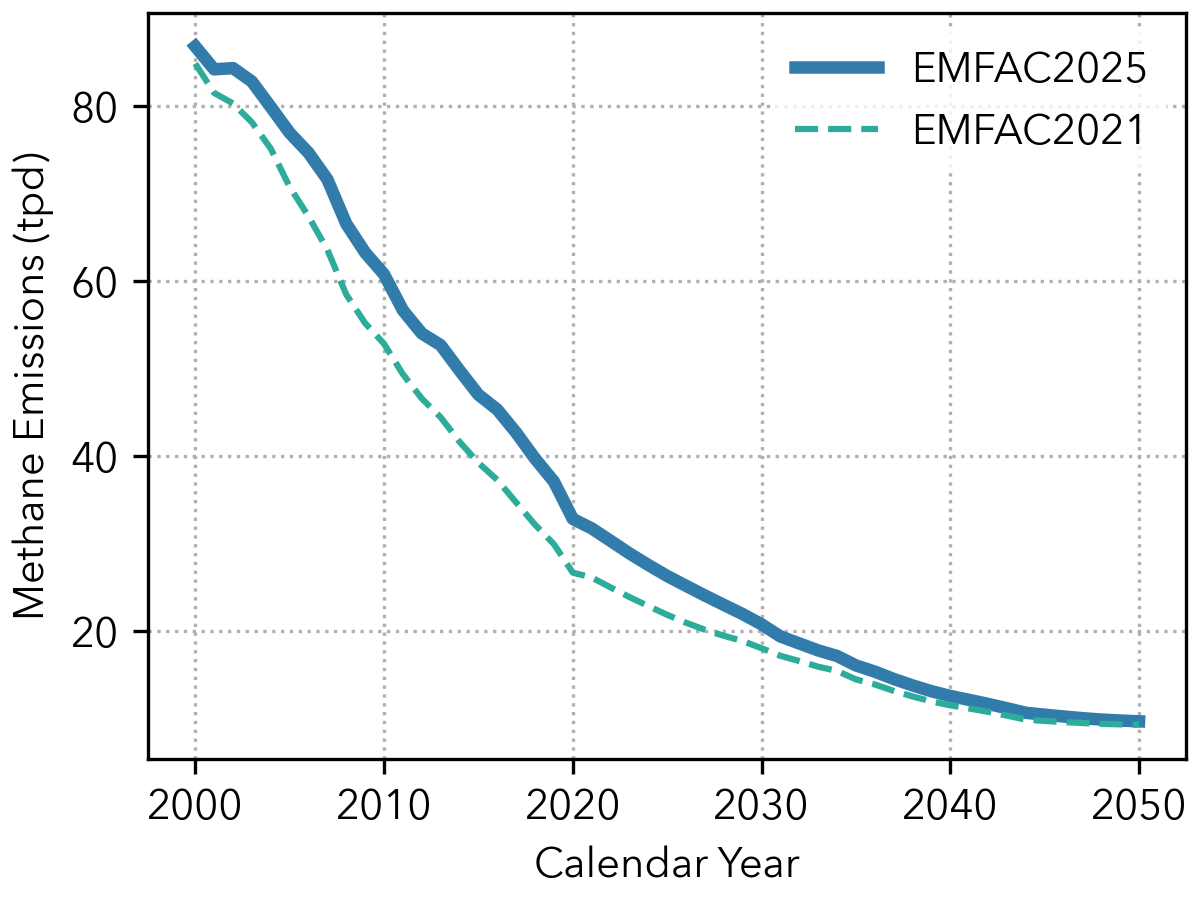
Figure 5.13: Statewide Methane Emissions from Light- and Heavy-Duty Vehicles: EMFAC2025 vs. EMFAC2021#