8.1. Battery-Electric Vehicles and Plug-in Hybrid Vehicles#
The energy module within EMFAC estimates the total electricity consumption (kWh) needed to power the electric vehicle fleet, including both Battery-Electric Vehicles (BEV) and Plug-in Hybrid Vehicles (PHEV). The electricity consumption is determined by multiplying energy consumption rates (kWh/mi) by the electric VMT (eVMT) of each subfleet category. Such estimates and their projections into the future are valuable for infrastructure and utility planning. EMFAC estimates energy consumption for both light-duty and heavy-duty vehicle categories. This section will focus on light-duty and the following section will overview heavy-duty.
The light-duty energy module was updated using the DMV inventory of BEVs and PHEVs, data from fueleconomy.gov, and the UC Davis BEV and PHEV travel behavior study (Tal et al., 2020), which are summarized in Table 8.1.
Data source |
Information |
|---|---|
DMV inventory |
Population of all registered cars |
Fuel economy of all makes and models |
|
UC Davis BEV and PHEV travel behavior study (Tal et al., 2020) |
Real-world energy consumption by speed bins |
The UC Davis data was generated using dataloggers that collected second-by-second data from 300 different BEV and PHEV vehicles with MYs ranging from 2012–2019. Each vehicle was logged for about one year while routinely driven on California roads by the vehicle owner and generally averaged typical accrual rates of just over 12,000 miles/year.
The UC Davis data was used to determine real-world energy efficiencies (kWh/mi) for three makes and models: the Tesla Model S (BEV), Nissan Leaf (BEV), and Chevy Volt (PHEV). The determined efficiencies were compared to the fueleconomy.gov energy efficiencies as inventory-weighted averages, which indicated that fueleconomy.gov underestimates BEV and PHEV energy consumption by 9%. The UC Davis data also showed evidence that BEVs can experience a loss of battery charge while parked, and to correctly account for this “stop-loss,” another 2.3% correction was needed. Then, staff used the California DMV inventory of BEVs and PHEVs, and the comprehensive energy consumption values from fueleconomy.gov to develop inventory-weighted energy consumption for each light-duty weight class (LDA, LDT1, LDT2, and MDV), as shown below in Figure 8.1. For each category, the 9% and 2.3% corrections were applied to account for real-world driving and stop-losses, respectively. For each increasing weight class, the energy consumption rates increased, and each PHEV weight class had a higher energy consumption rate than the corresponding BEV weight class.
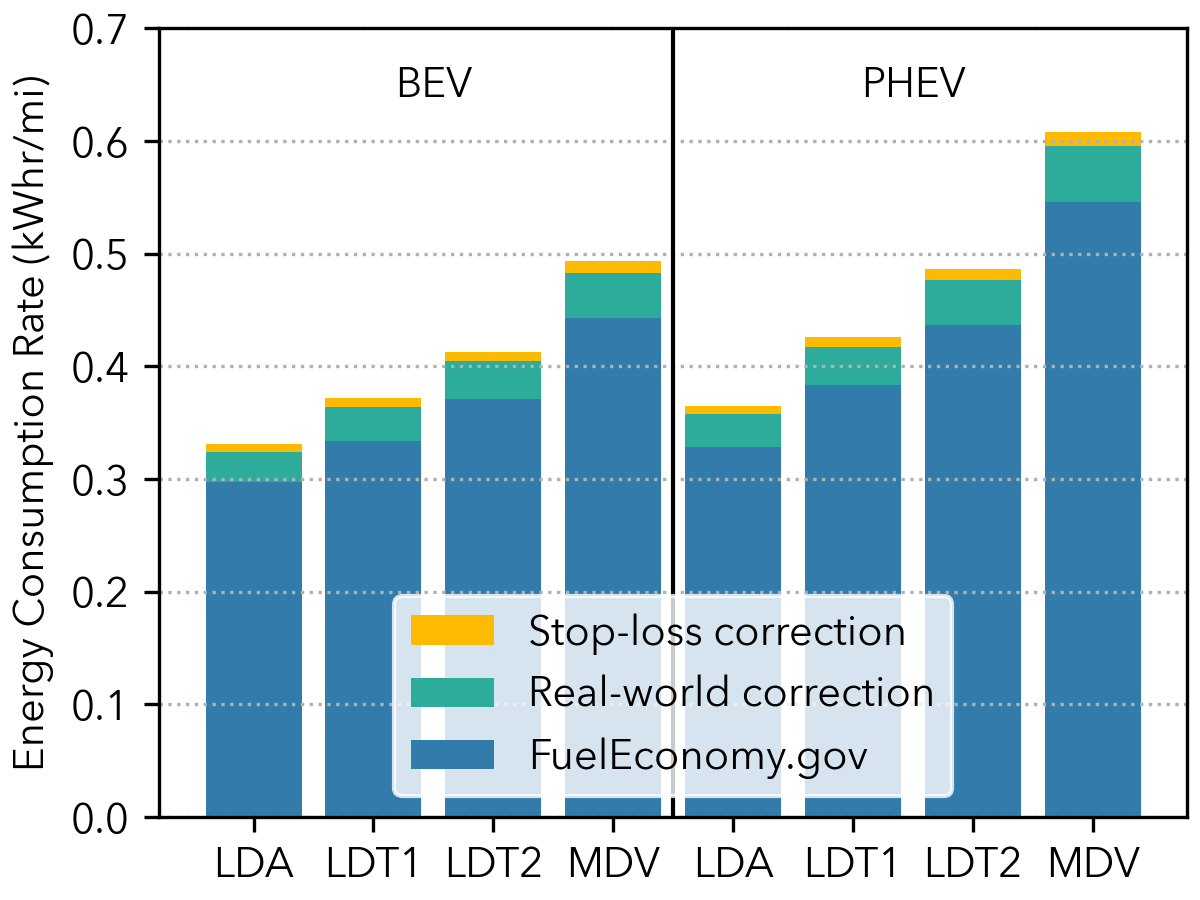
Figure 8.1: Energy Consumption Rates for Light-Duty BEV and PHEV Vehicles#
Staff used the UC Davis dataset for two other purposes: to bin out the average energy consumption (as shown below) into speed-distributed energy consumption, and to determine the electric VMT (eVMT) speed distributions used within EMFAC2025. Unique distributions were generated for BEV and PHEV powertrains. The BEV eVMT and energy consumption speed distributions were based on an inventory-weighted average of the Nissan Leaf and the Tesla Model S. The PHEV distributions were based solely on the Chevrolet Volt, since all other PHEVs in the UC Davis datalogging study operated in a blended mode (e.g., Toyota Prius Prime). Blended PHEV driving data exhibited evidence that engine-on operation was impacting the calculated efficiencies, even when second-by-second data filtering methods to remove engine-on operation were applied. As a result, staff decided to only use unblended PHEVs to inform the energy model update, which limited the PHEV dataset to only the Chevrolet Volt. The result was two distinct eVMT speed distributions for BEV and PHEV models, as shown in Figure 8.2. The updated eVMT distributions shown in black are significantly higher speed than the previous eVMT distributions used in EMFAC2021.
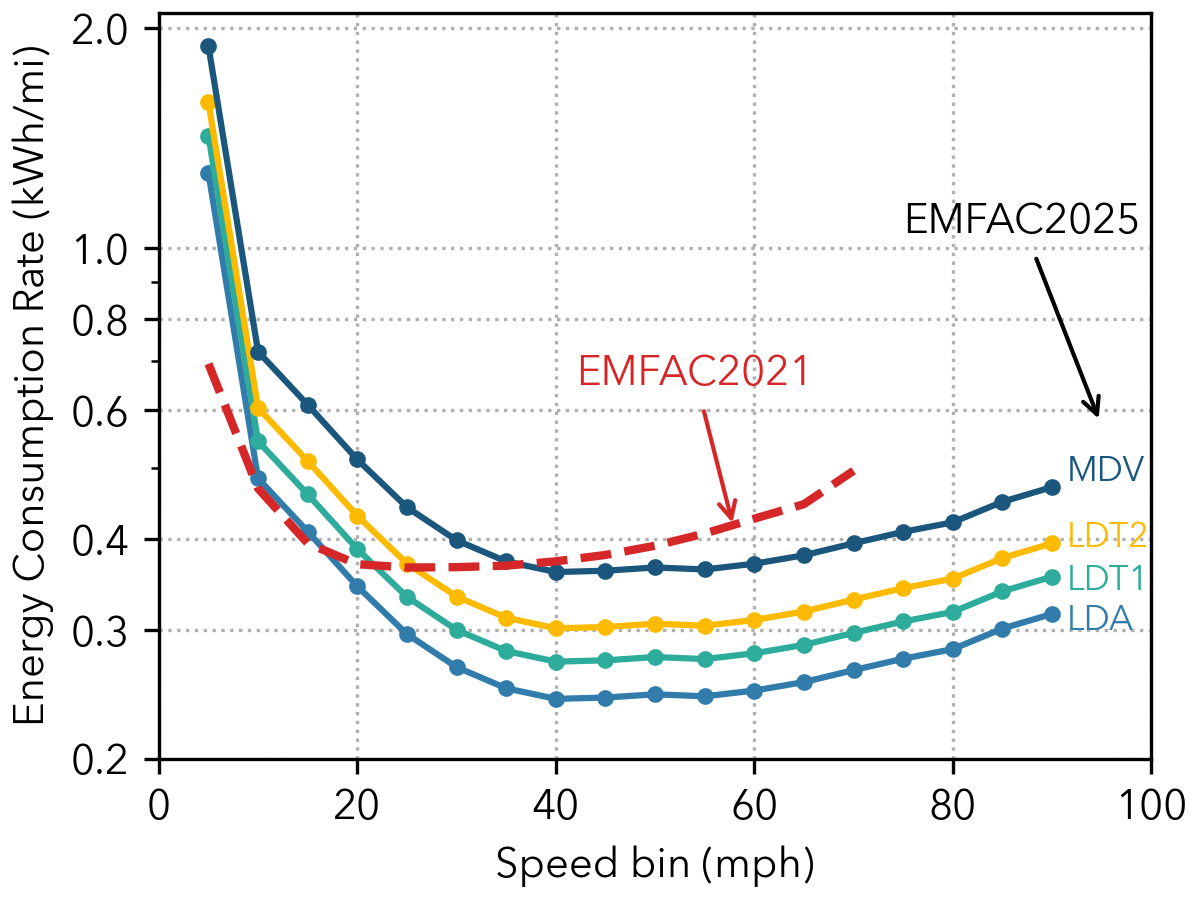
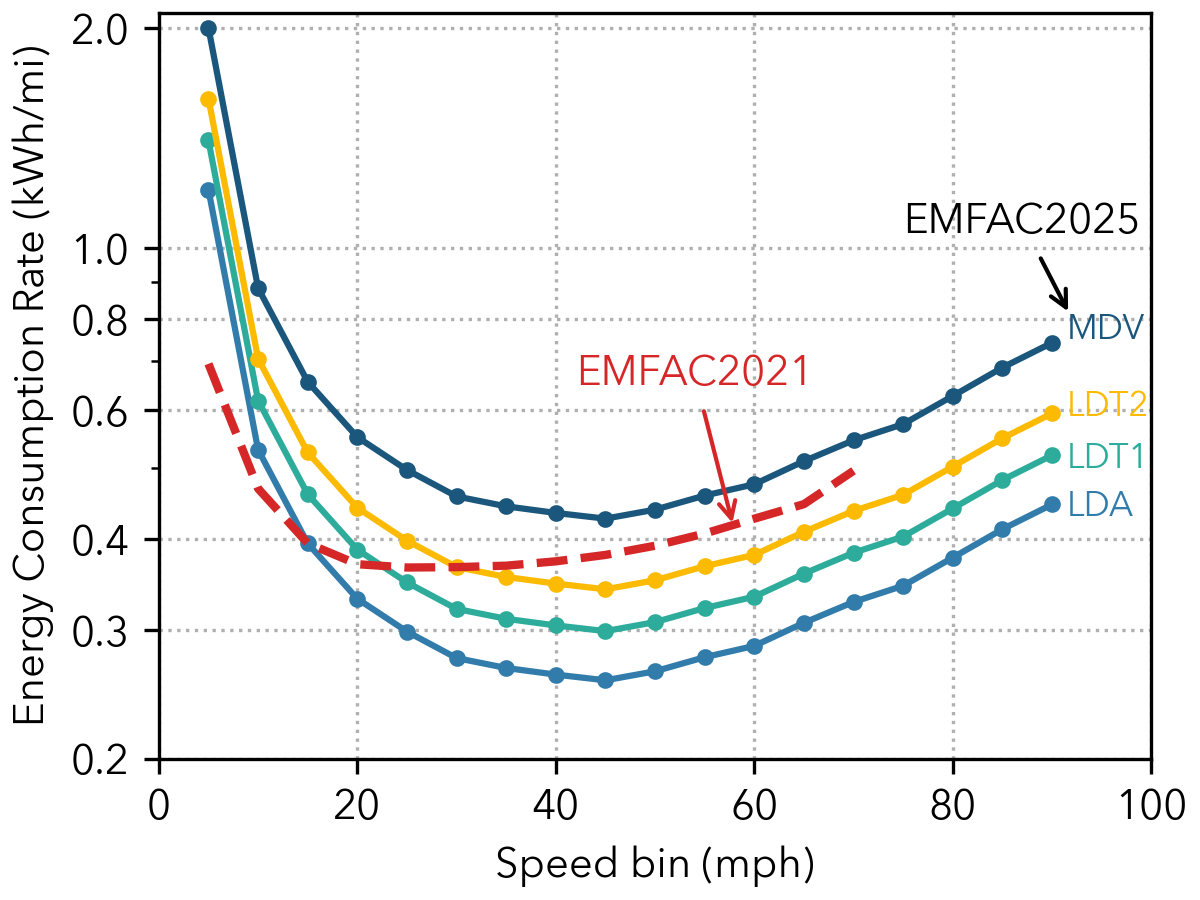
The speed distributions of energy consumption were determined for each weight class (LDA, LDT1, LDT2, MDV) of BEV and PHEV as shown in Figure 8.3. The lowest black line on both BEV and PHEV plots is LDA, which captures the majority of all BEVs and PHEVs on the road. For both BEV and PHEV, the energy consumption rates from EMFAC2025 are higher (less efficient) than those estimated by EMFAC2021 at lower speeds, but lower (more efficient) than EMFAC2021 at higher speeds. In the case of PHEV LDT2 and MDV, the EMFAC2025 energy consumption rates exceed those of EMFAC2021 at all speeds.
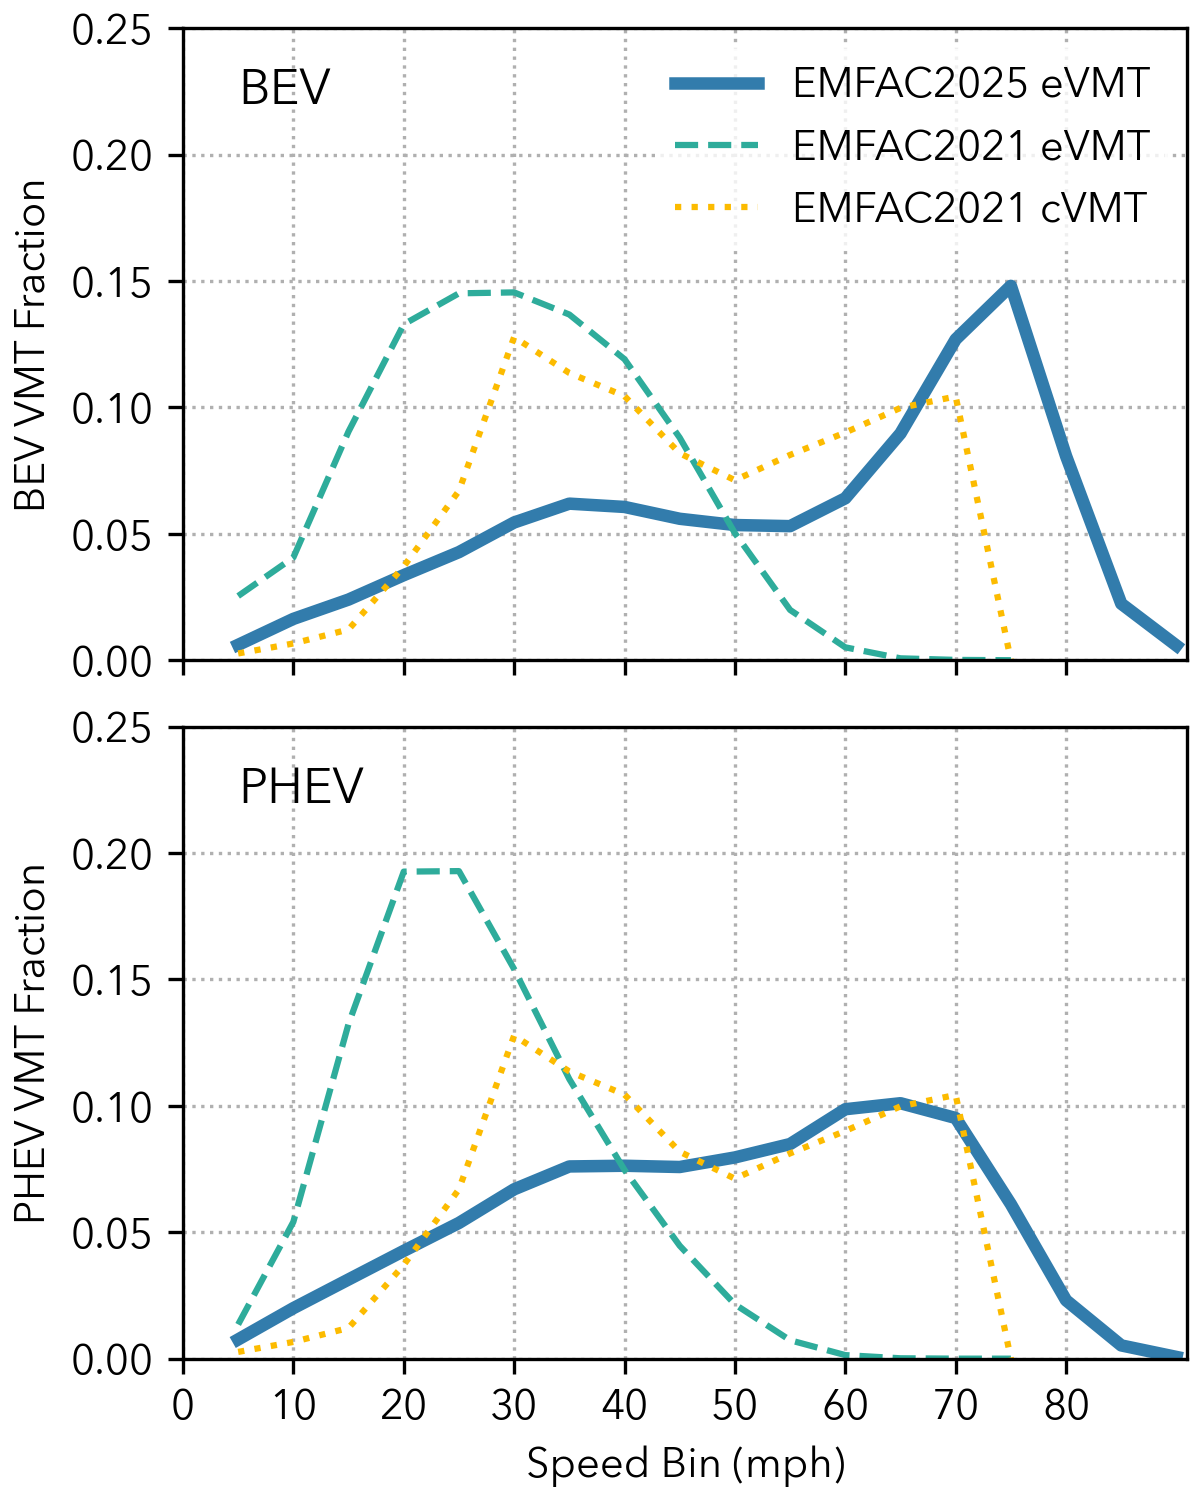
Figure 8.2: BEV and PHEV Electric Vehicle Miles Traveled (eVMT) Distributions: EMFAC2025 vs. EMFAC2021#
 BEV
BEV
 PHEV
PHEV
Figure 8.3: Speed Distributions of Energy Consumption Rates for Light-Duty BEV and PHEV. EMFAC2021’s energy consumption rates (dashed lines) are presented for comparison.#