6.1. Base Emission Rates#
Exhaust emissions from a vehicle’s tailpipe, such as hydrocarbons (HC), carbon monoxide (CO), and oxides of nitrogen (NOx), are influenced by variations in the combustion process that depend on vehicle operating conditions. In EMFAC, two light-duty vehicle operational modes contribute to exhaust emissions: the stabilized running mode and the start mode. This section provides a brief overview of the model’s handling of basic tailpipe emission rates and start emission rates. Emission rates, also referred to as emission factors, related to these sources are typically measured at standard temperature and humidity using driving cycles that mimic typical vehicle driving and operating patterns. Emission rates are ultimately combined with vehicle activity data (such as vehicle population counts and vehicle operation) to estimate vehicle emissions inventories.
EMFAC2025 retains the methodology for determining base emission rates (BER) from EMFAC2021, where the emissions characteristics of a vehicle technology group are represented by emission regimes and vehicle emissions deterioration is simulated by the movement of vehicles across regimes. The emission factors associated with each regime (i.e., regime emission factor) are then weighted using the percentage of vehicles within each regime (i.e., regime fractions). The model consists of four regimes, which are derived from certification standards (i.e., standards defined over the Federal Test Procedures – FTP) as shown in Table 6.1. These are described in detail in Section 4.3.1.1 of the EMFAC2021 Technical Documentation (CARB, 2021).
Emission Regime |
Emission Range |
|---|---|
Low |
0 to 0.5 \(\times\) Standard |
Normal |
0.5 to 1.0 \(\times\) Standard |
Moderate |
1.0 to 2.0 \(\times\) Standard |
High |
>2.0 \(\times\) Standard |
The method for BER determination in EMFAC2025 is similar to EMFAC2021, including the test cycle (UC cycle), data sources, and the definition of technology groups. UC BERs are based on three years of new data from the U.S. EPA’s In-Use Vehicle Program (IUVP) and CARB’s Vehicle Surveillance Program (VSP), including running and start exhaust emission rates of HC, NOx, and CO for LEV I and LEV II technology groups. New data are also used to update the ROS for the LEV III BERs, as explained in detail later in this section. In general, to update BERs, the following steps were taken:
Acquire the IUVP data (FTP results) for the selected tech group
Acquire the California sales data for each tech group from the NMOG report, if available
Determine the sales-weighted regime fractions and average emission rates versus odometer bins for the FTP data
Gather test data for the selected tech group from VSP under the FTP and UC tests
Classify FTP composite emission rate data into low, normal, moderate, and high regimes
Select vehicles tested under both the FTP and UC
Determine the average value of UC results for each emission regime.
LEV III technology groups (LEV160, ULEV125, SULEV30) have the same exhaust NMOG+NOx standards as LEV II technology groups (LEV, ULEV, SULEV) but with tightened durability requirements of 150,000 miles compared to 120,000 miles under LEV II. Thus, for LEV III technology groups (model years 2015 and later), EMFAC assumes that LEV160, ULEV125, and SULEV30 share the same running and start exhaust emission regressions as their respective LEV II counterparts (LEV, ULEV, SULEV). For other LEV III certification levels such as ULEV70, ULEV50, and SULEV20, a Ratio of Standards (ROS) approach is used to estimate emission rates due to limited data availability for developing technology-specific regressions. The ROS scalar is calculated as the ratio of the LEV III HC+NOx certification standard to that of the corresponding LEV II baseline, as shown in Table 6.2. This scalar is then applied to the base emission rates (BER) of the corresponding LEV II group to estimate emissions for the newer technology categories.
New Tech Group |
Base |
Ratio of Standards |
|---|---|---|
LEV III ULEV70 |
LEV II ULEV125 |
70/125 = 0.56 |
LEV III ULEV50 |
LEV II ULEV125 |
50/125 = 0.40 |
LEV III SULEV20 |
LEV II SULEV30 |
20/30 = 0.67 |
Tables 6.3 and 6.4 show sample results for IUVP and VSP data for HC emissions associated with LEV II ULEVs, respectively. U.S. EPA’s IUVP data were used to determine the fractions of low, normal, moderate, and high emitters versus odometer for LEV I and LEV II vehicles. The IUVP results were weighted by the California sales of each test group. Sales data were obtained from the manufacturer non-methane organic gas (NMOG) reports to CARB. The CARB VSP program provides the UC cycle-based emission levels for the emission regimes. The emission rates are computed in terms of fraction of vehicles in an emission regime (either low, normal, moderate, or high emission, as a function of odometer), averaging the corresponding UC emission rate over odometer bins for that regime. Finally, a curve is fitted to average emission rates for each bin versus odometer.
Odometer Bin |
Regime |
Count |
Regime Fraction |
Sales Weighted Regime Fraction |
|---|---|---|---|---|
0–50 kmi |
Low |
1330 |
0.937 |
0.902 |
Normal |
88 |
0.062 |
0.098 |
|
Moderate |
1 |
0.001 |
0.000 |
|
High |
1 |
0.001 |
0.000 |
|
50–100 kmi |
Low |
911 |
0.686 |
0.673 |
Normal |
411 |
0.309 |
0.322 |
|
Moderate |
3 |
0.002 |
0.001 |
|
High |
3 |
0.002 |
0.004 |
|
100–150 kmi |
Low |
105 |
0.528 |
0.511 |
Normal |
93 |
0.467 |
0.488 |
|
Moderate |
1 |
0.005 |
0.002 |
|
High |
0 |
0.000 |
0.000 |
Odometer Bin |
Regime |
Count |
Mean HC (g/mi) |
|---|---|---|---|
UC Phase 1 (Cold Start) |
Low |
40 |
0.385 |
Normal |
30 |
0.511 |
|
Moderate |
8 |
0.618 |
|
High |
0 |
0.618 |
|
UC Phase 2 (Running) |
Low |
40 |
0.011 |
Normal |
30 |
0.013 |
|
Moderate |
8 |
0.021 |
|
High |
0 |
0.021 |
|
UC Phase 3 (Warm Start) |
Low |
40 |
0.025 |
Normal |
30 |
0.033 |
|
Moderate |
8 |
0.043 |
|
High |
0 |
0.043 |
Emission rates are modeled in the form of regression equations with vehicle mileage (odometer in units of 10,000 miles) as an input to the model. To do this, staff fitted a curve to regime fractions as a function of odometer and calculated the weighted average emission rates for each phase of the UC cycle for different odometers. The resulting emission rates were again fitted with regressions as a function of odometer, and these estimated emission rates were then used in the model. Table 6.5 shows the number of vehicles added to the dataset in EMFAC2025 and the methodologies used to derive the base emission rates in each technology group.
Technology Group |
EMFAC2025 |
EMFAC2021 |
|
|---|---|---|---|
LEV I |
LEV |
N = 290 |
N = 237 |
ULEV |
N = 87 |
N = 72 |
|
LEV II |
LEV160 |
N = 37 |
N = 33 |
ULEV125 |
N = 78 |
N = 78 |
|
SULEV30 |
N = 76 |
N = 49 |
|
LEV III |
LEV160 |
Same as LEV II LEV160 |
Same as LEV II LEV160 |
ULEV125 |
Same as LEV II ULEV125 |
Same as LEV II ULEV125 |
|
ULEV70 |
Ratio of Standards |
Ratio of Standards |
|
ULEV50 |
Ratio of Standards |
Ratio of Standards |
|
SULEV30 |
Same as LEV II SULEV30 |
Same as LEV II SULEV30 |
|
SULEV20 |
Ratio of Standards |
Ratio of Standards |
|
6.1.1. Hydrocarbon (HC) Base Emission Rates#
Figures 6.1 to 6.8 show a comparison between EMFAC2025 and EMFAC2021 HC base emission rates. For the LEV I LEV technology group, cold start, running exhaust, and warm start emission rates for HC are higher in EMFAC2025 than in EMFAC2021, as illustrated in Figure 6.1. For the LEV I ULEV group, cold start HC emission rates are higher in EMFAC2025 compared to EMFAC2021, as shown in Figure 6.2. However, for running exhaust emissions, EMFAC2025 shows lower HC rates at lower odometer readings and higher rates at higher odometer readings compared to EMFAC2021, as illustrated in Figure 6.2. As shown in Figure 6.2, warm start HC emissions for LEV I ULEV are mostly lower in EMFAC2025. As shown in Figures 6.3 to 6.8, EMFAC2025 generally shows lower cold start HC emission rates than EMFAC2021 for LEV II and LEV III technology groups, except for LEV II LEV160 and LEV II ULEV125, which have slightly higher HC cold start emissions than EMFAC2021. Additionally, lower deterioration in HC cold start emission rates at higher odometer readings is observed in EMFAC2025, particularly for newer technology groups such as ULEV70, ULEV50, SULEV30, and SULEV20. As shown in Figures 6.3 and 6.4, LEV II LEV160 and LEV II ULEV125 technology groups exhibit higher running exhaust base emission rates and greater deterioration. In contrast, LEV III groups in EMFAC2025 generally show lower running exhaust emissions and reduced deterioration at higher odometer ranges. Higher warm start HC base emission rates and deterioration are observed in EMFAC2025 for LEV II LEV160 and LEV II ULEV125 groups compared to EMFAC2021, as shown in Figures 6.3 and 6.4. Newer LEV III groups (ULEV70, ULEV50, SULEV30, and SULEV20) exhibit lower warm start HC emission rates and reduced deterioration at high odometer readings.
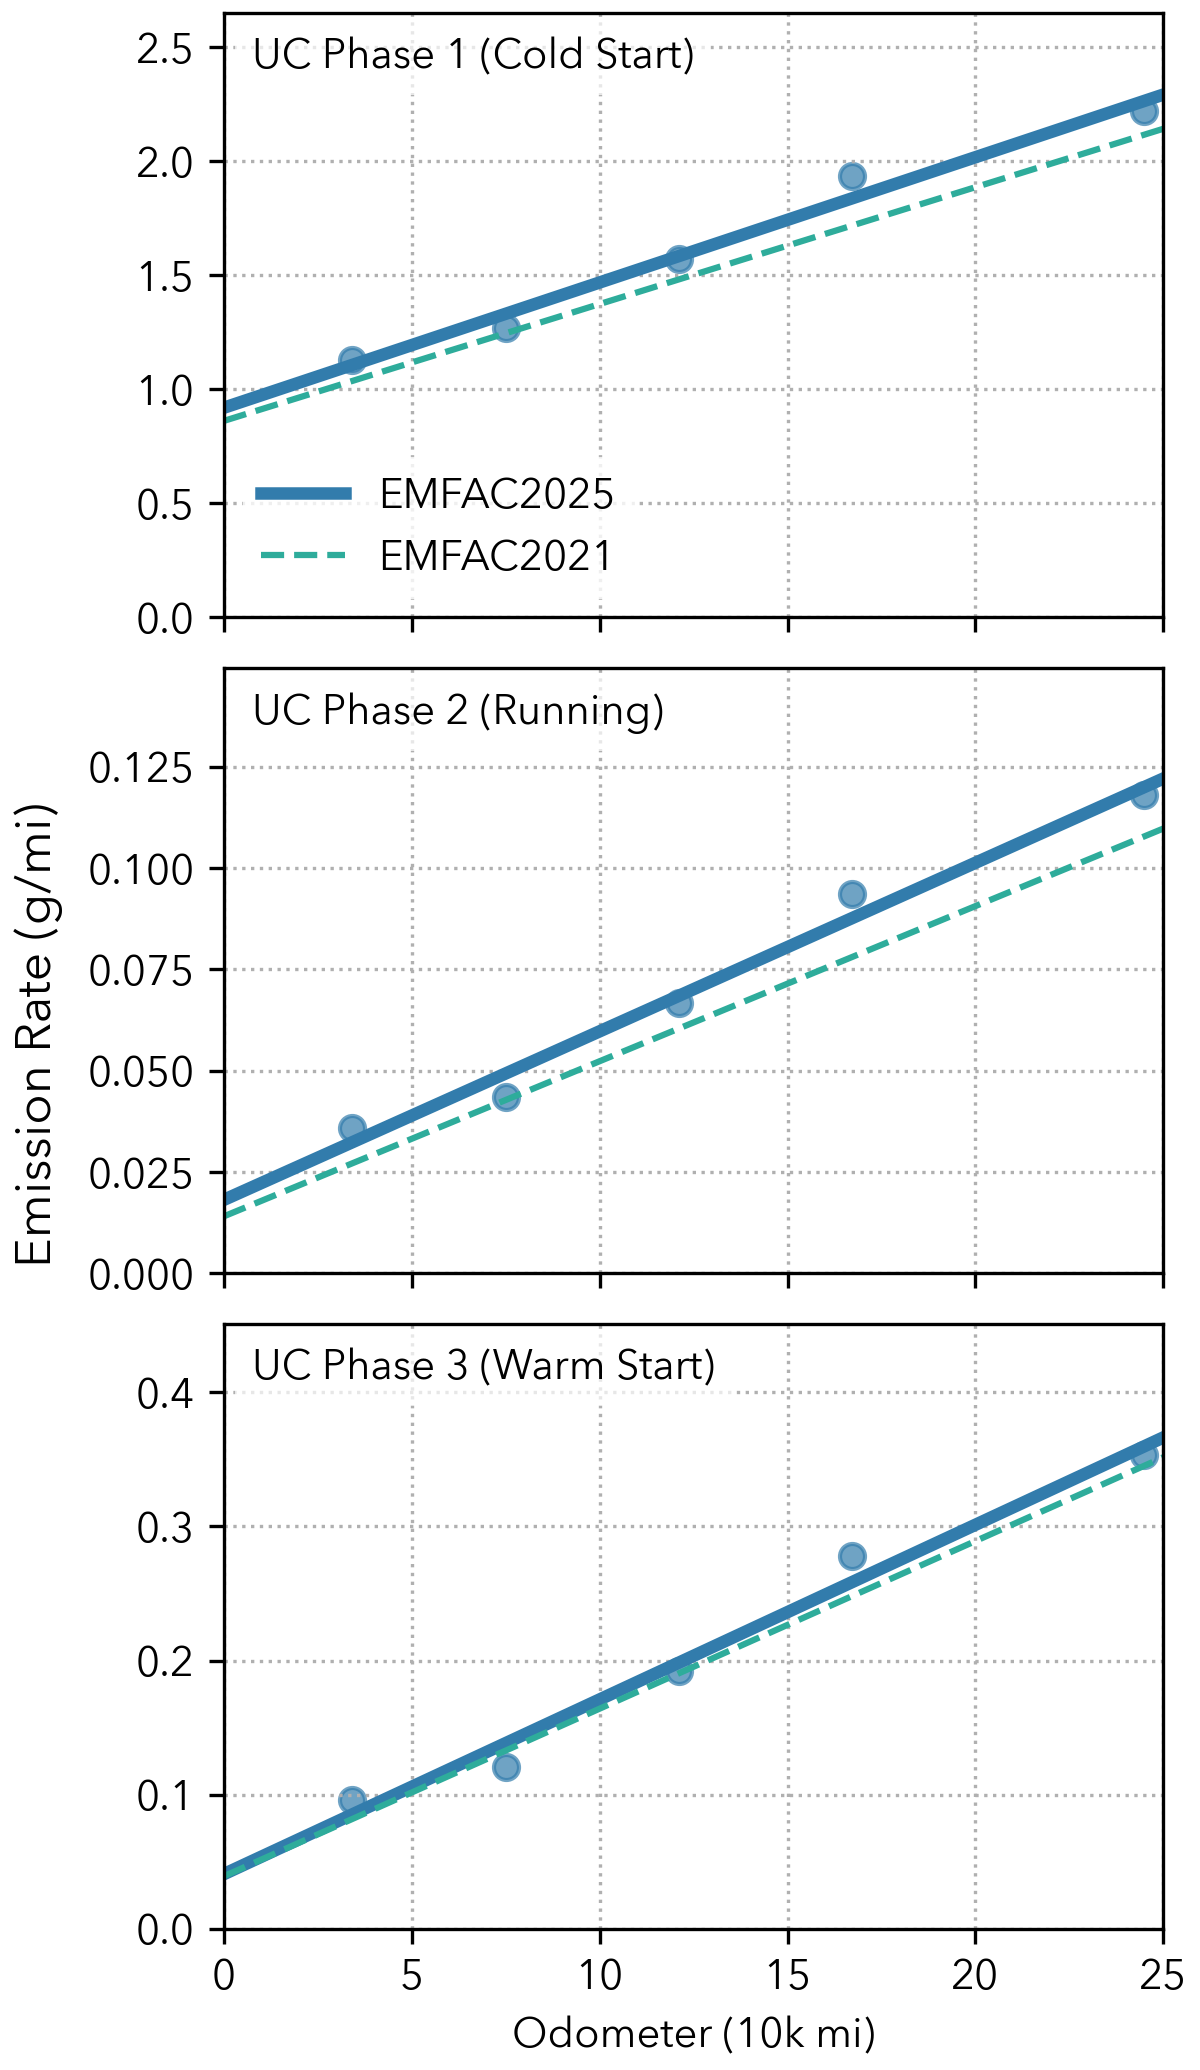
Figure 6.1: HC Emission Rates of LEV I LEV#
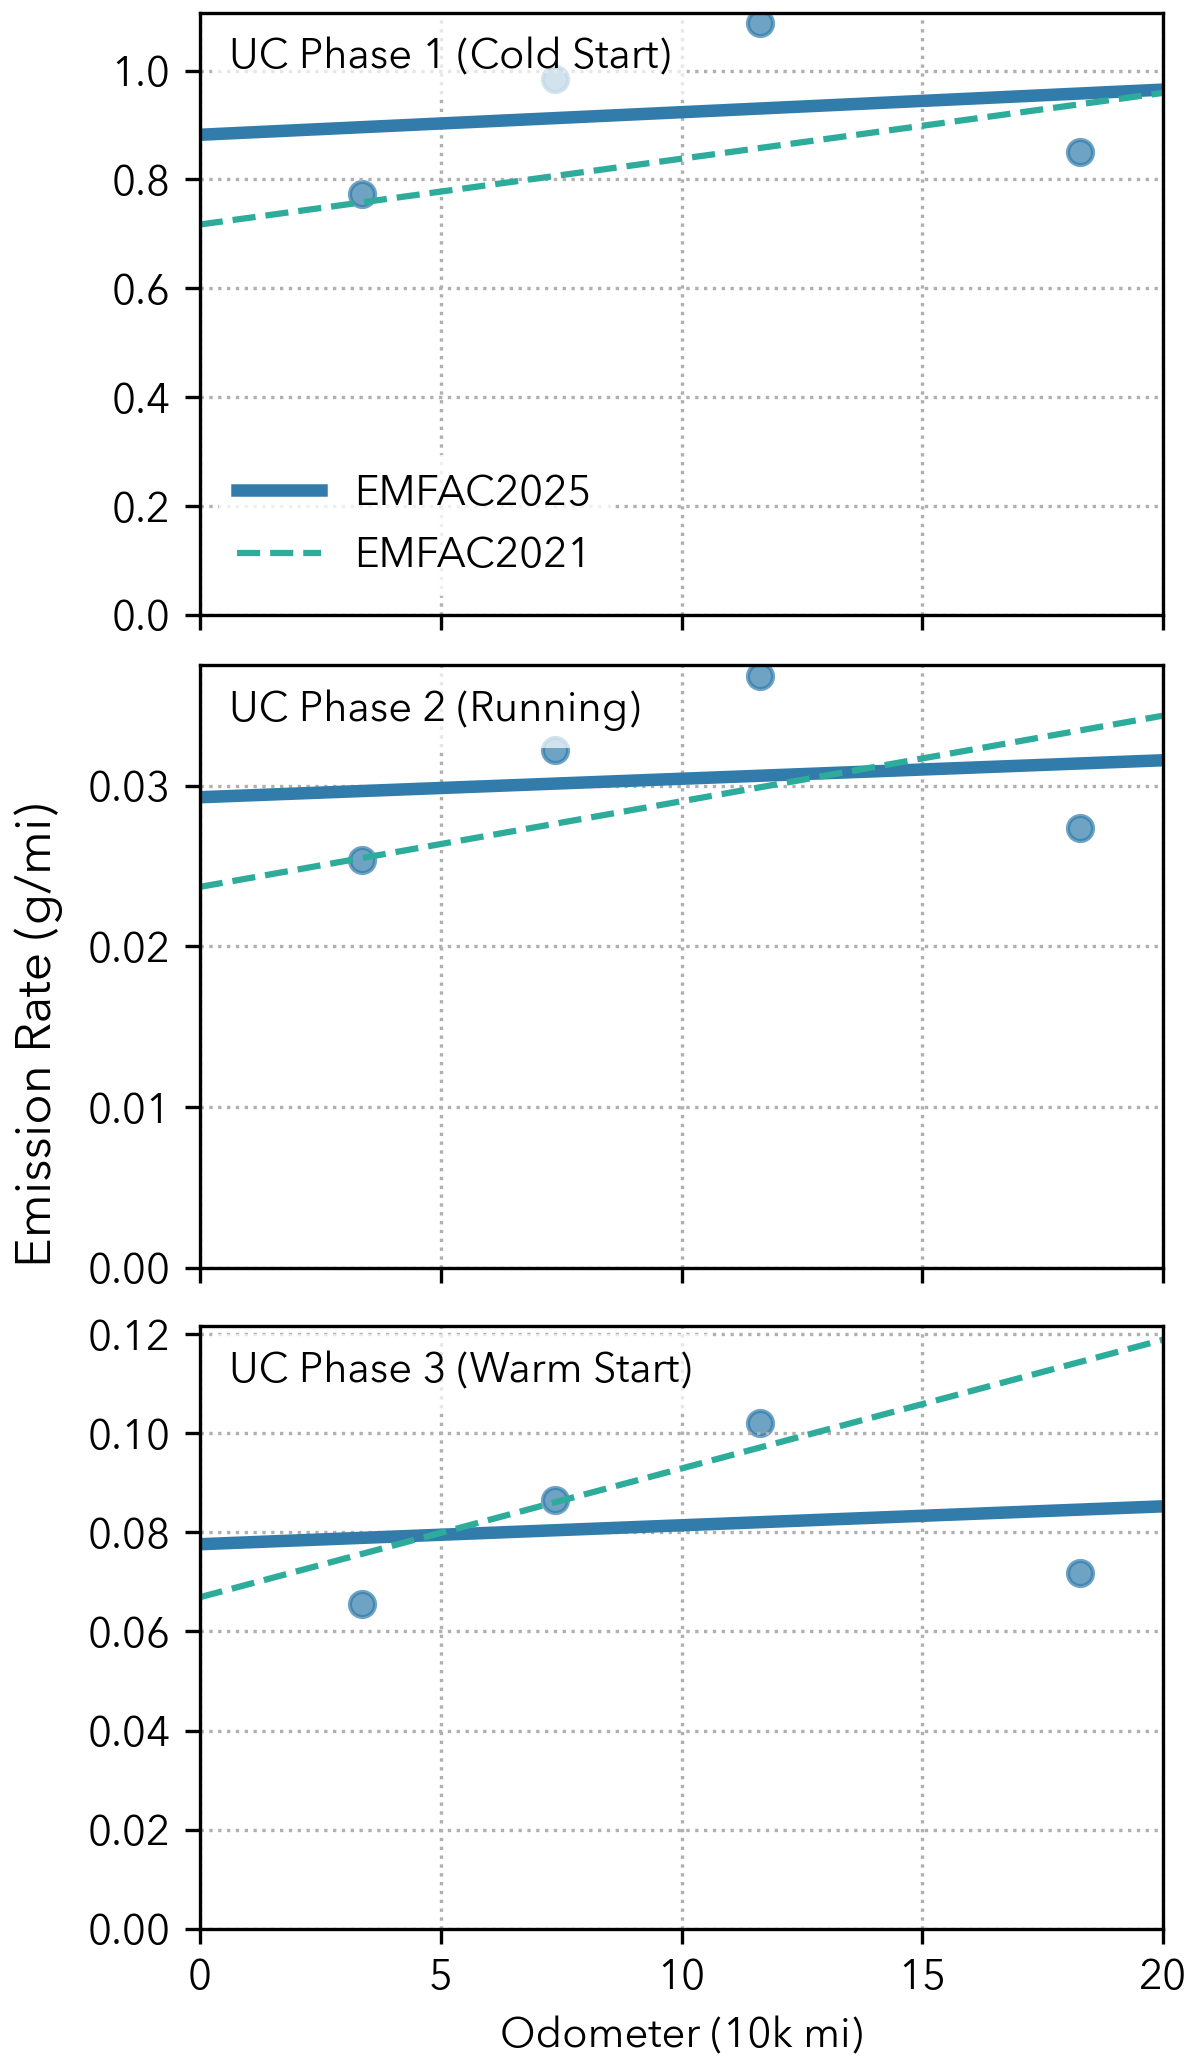
Figure 6.2: HC Emission Rates of LEV I ULEV#
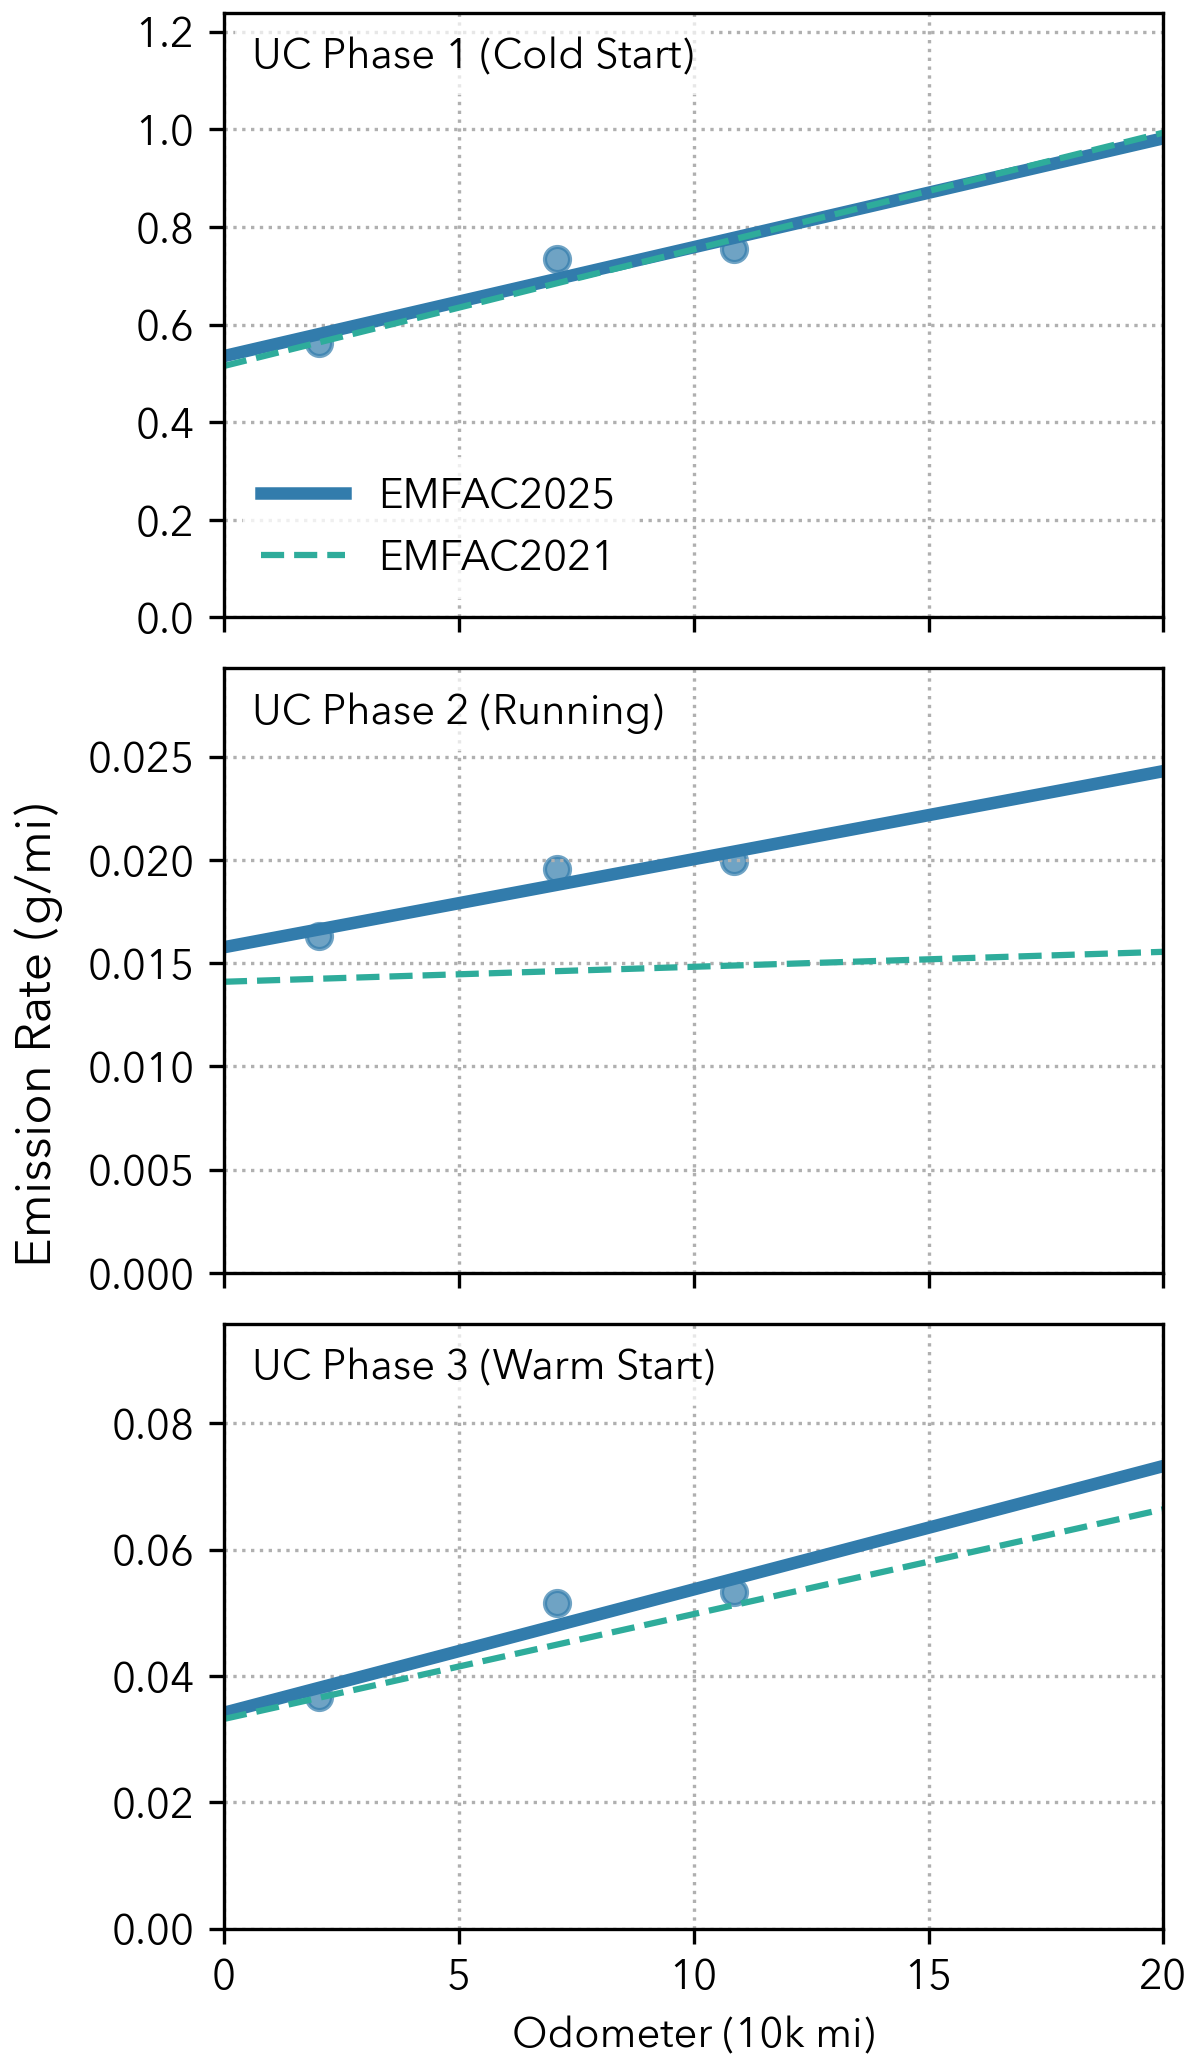
Figure 6.3: HC Emission Rates of LEV II/LEV III LEV160#
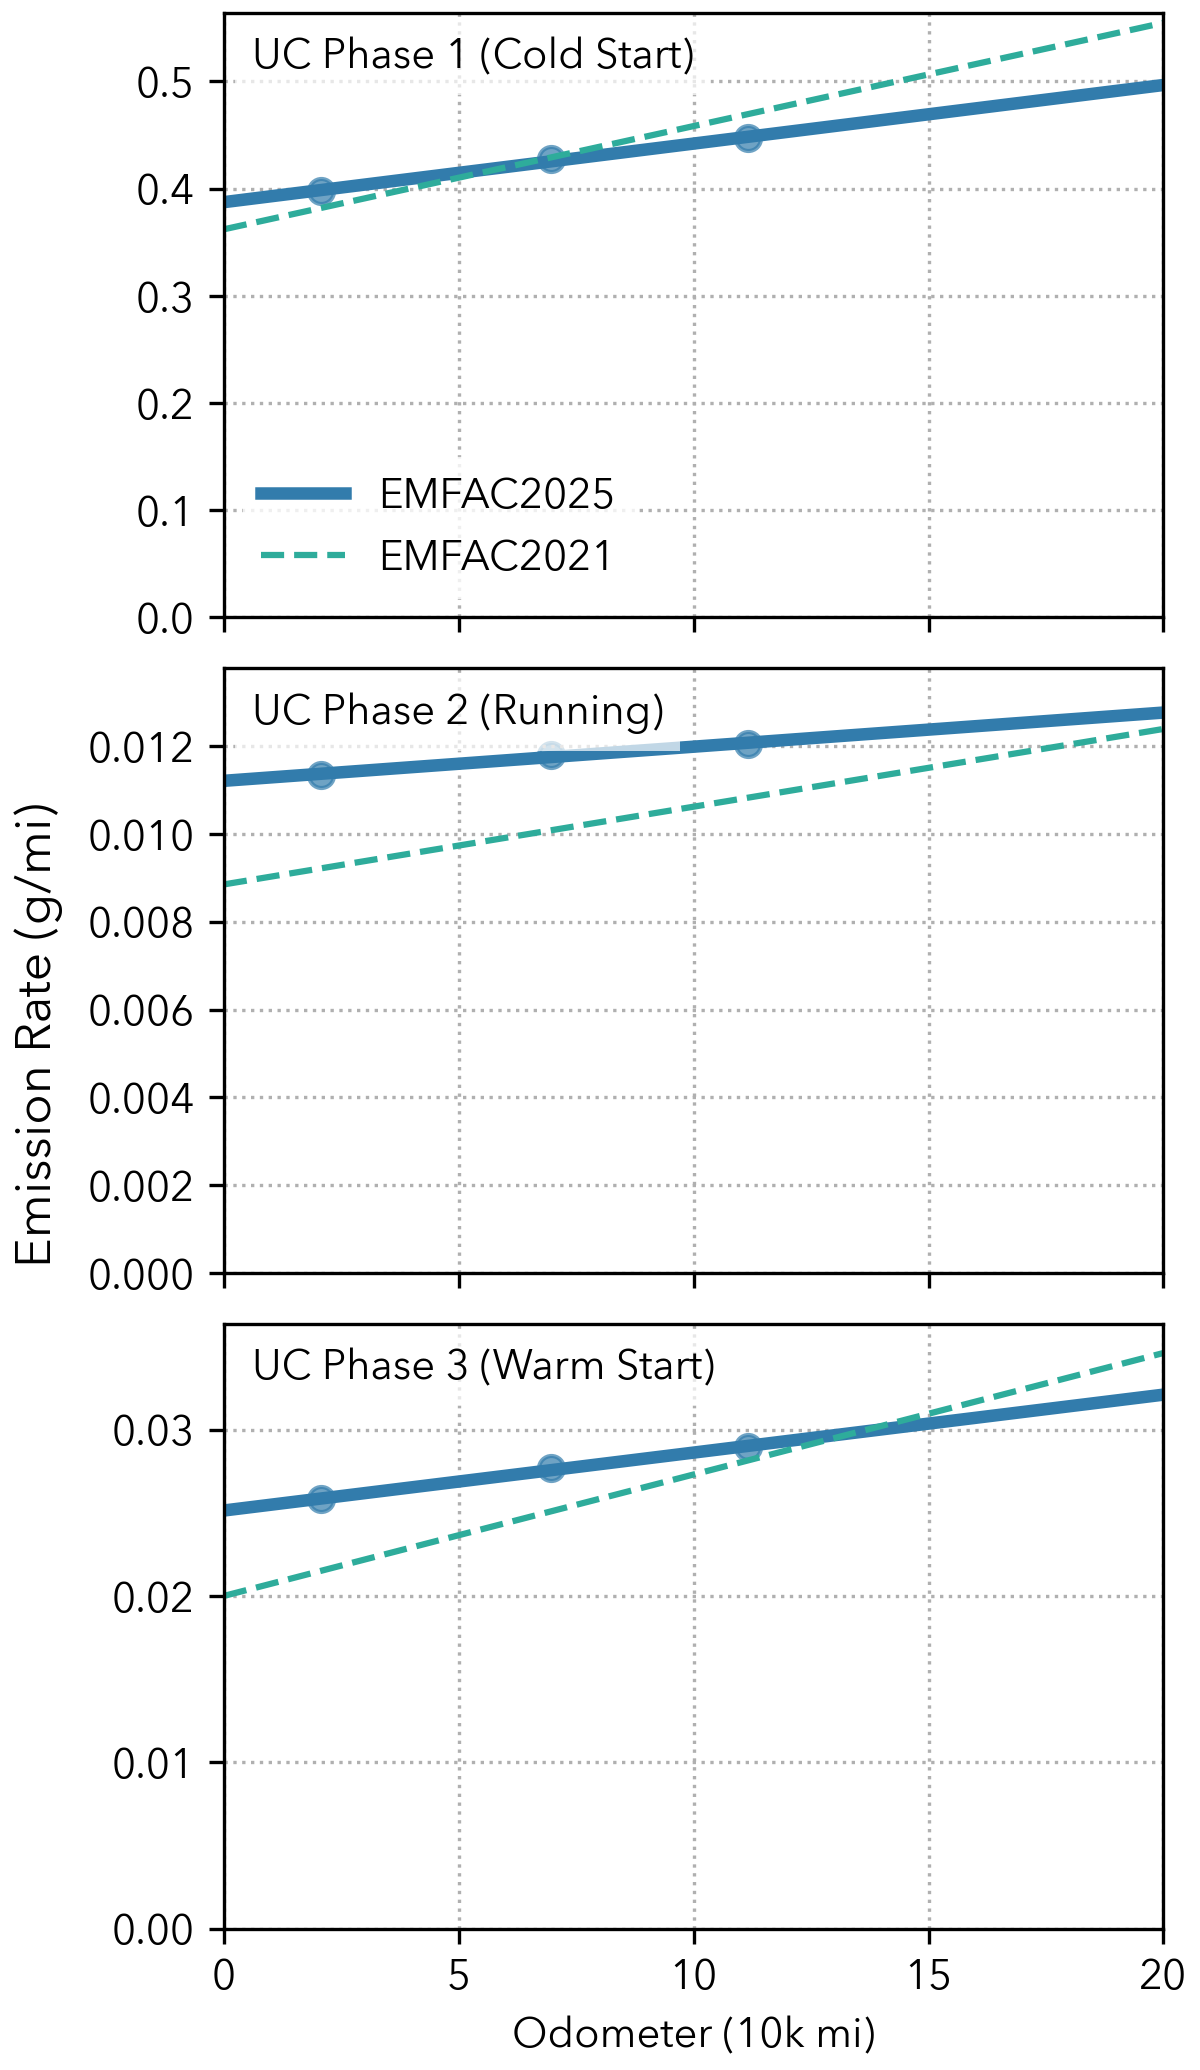
Figure 6.4: HC Emission Rates of LEV II/LEV III ULEV125#
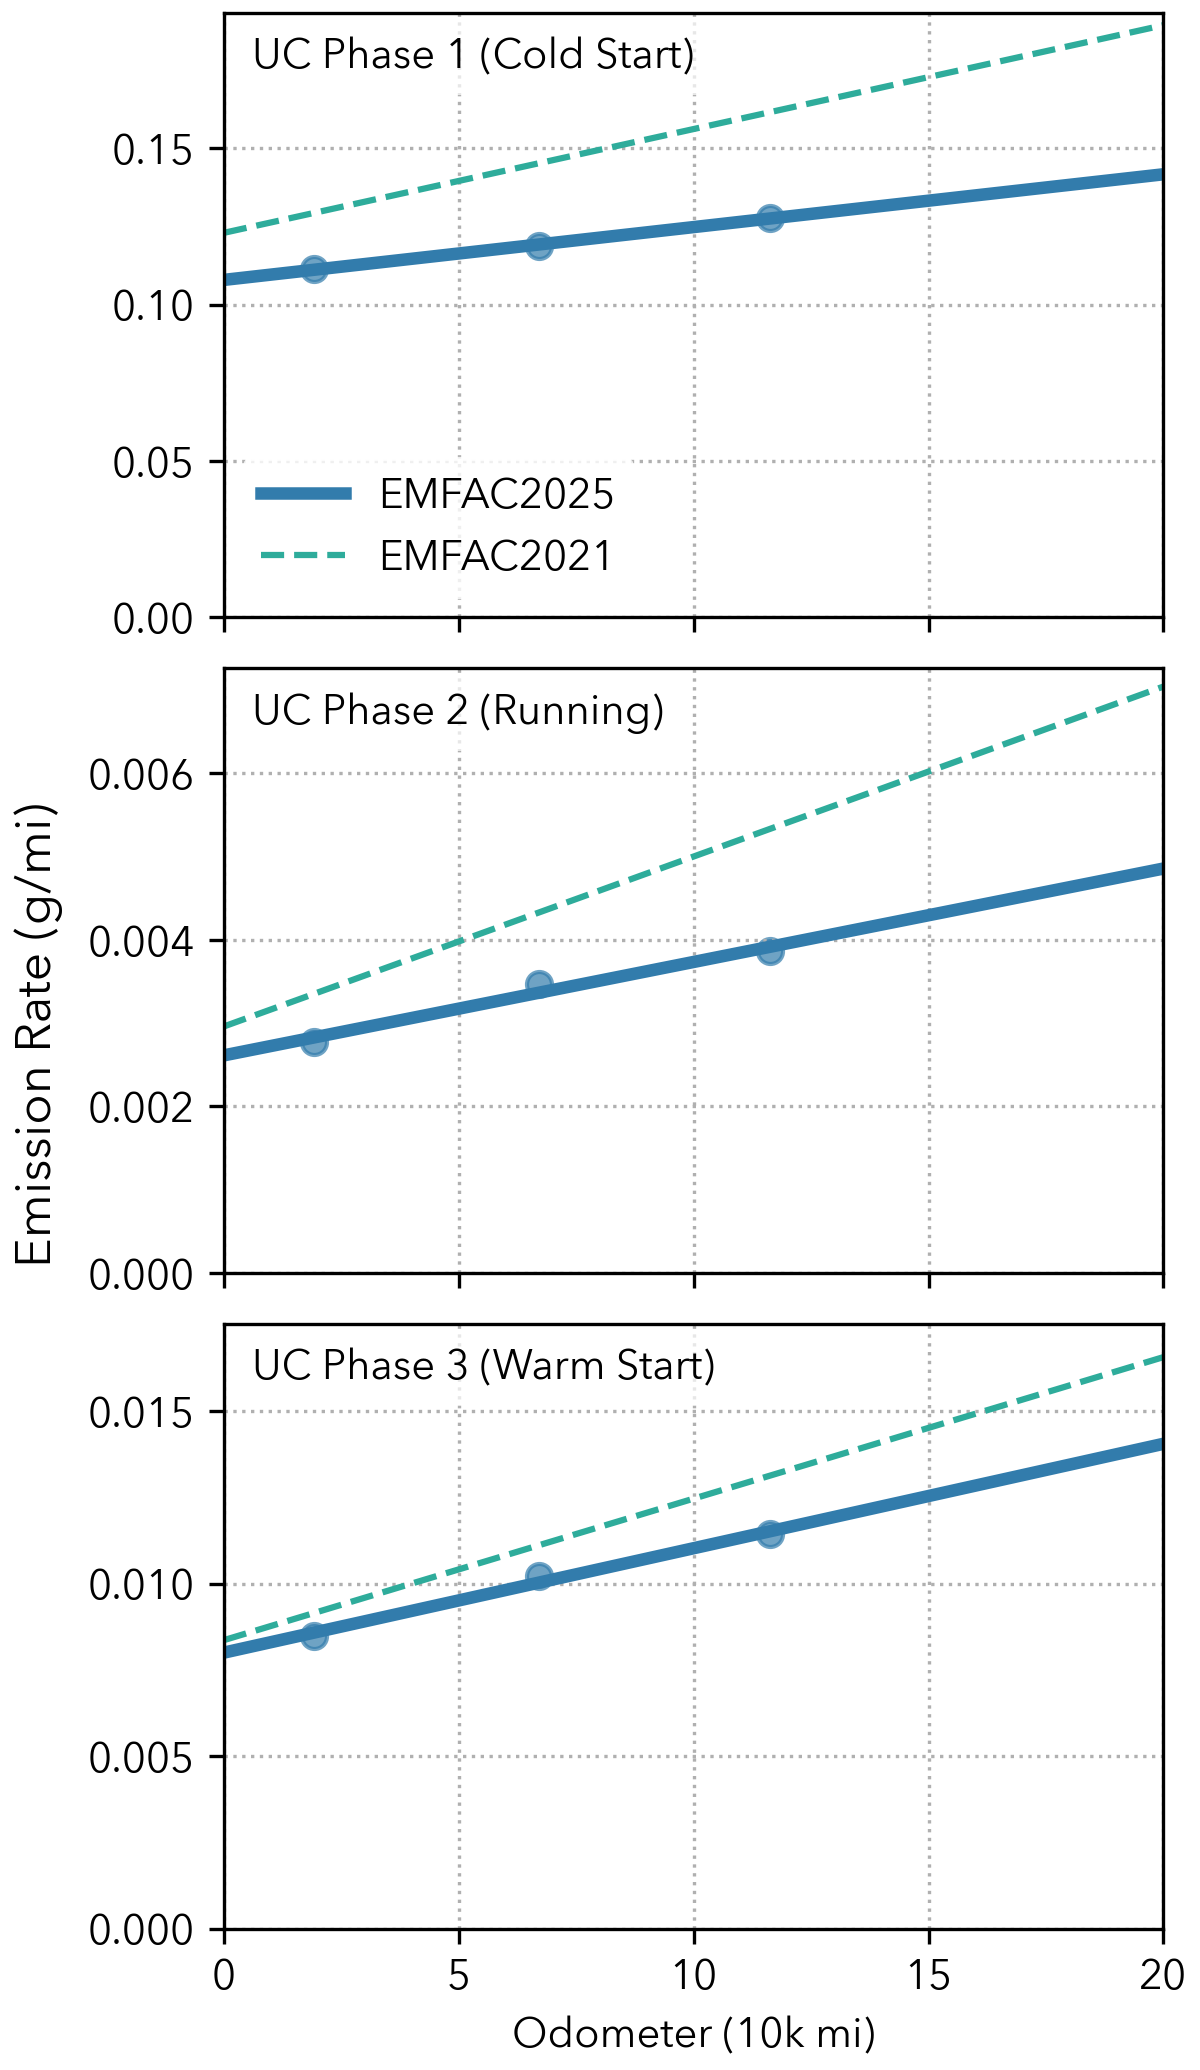
Figure 6.5: HC Emission Rates of LEV II/LEV III SULEV30#
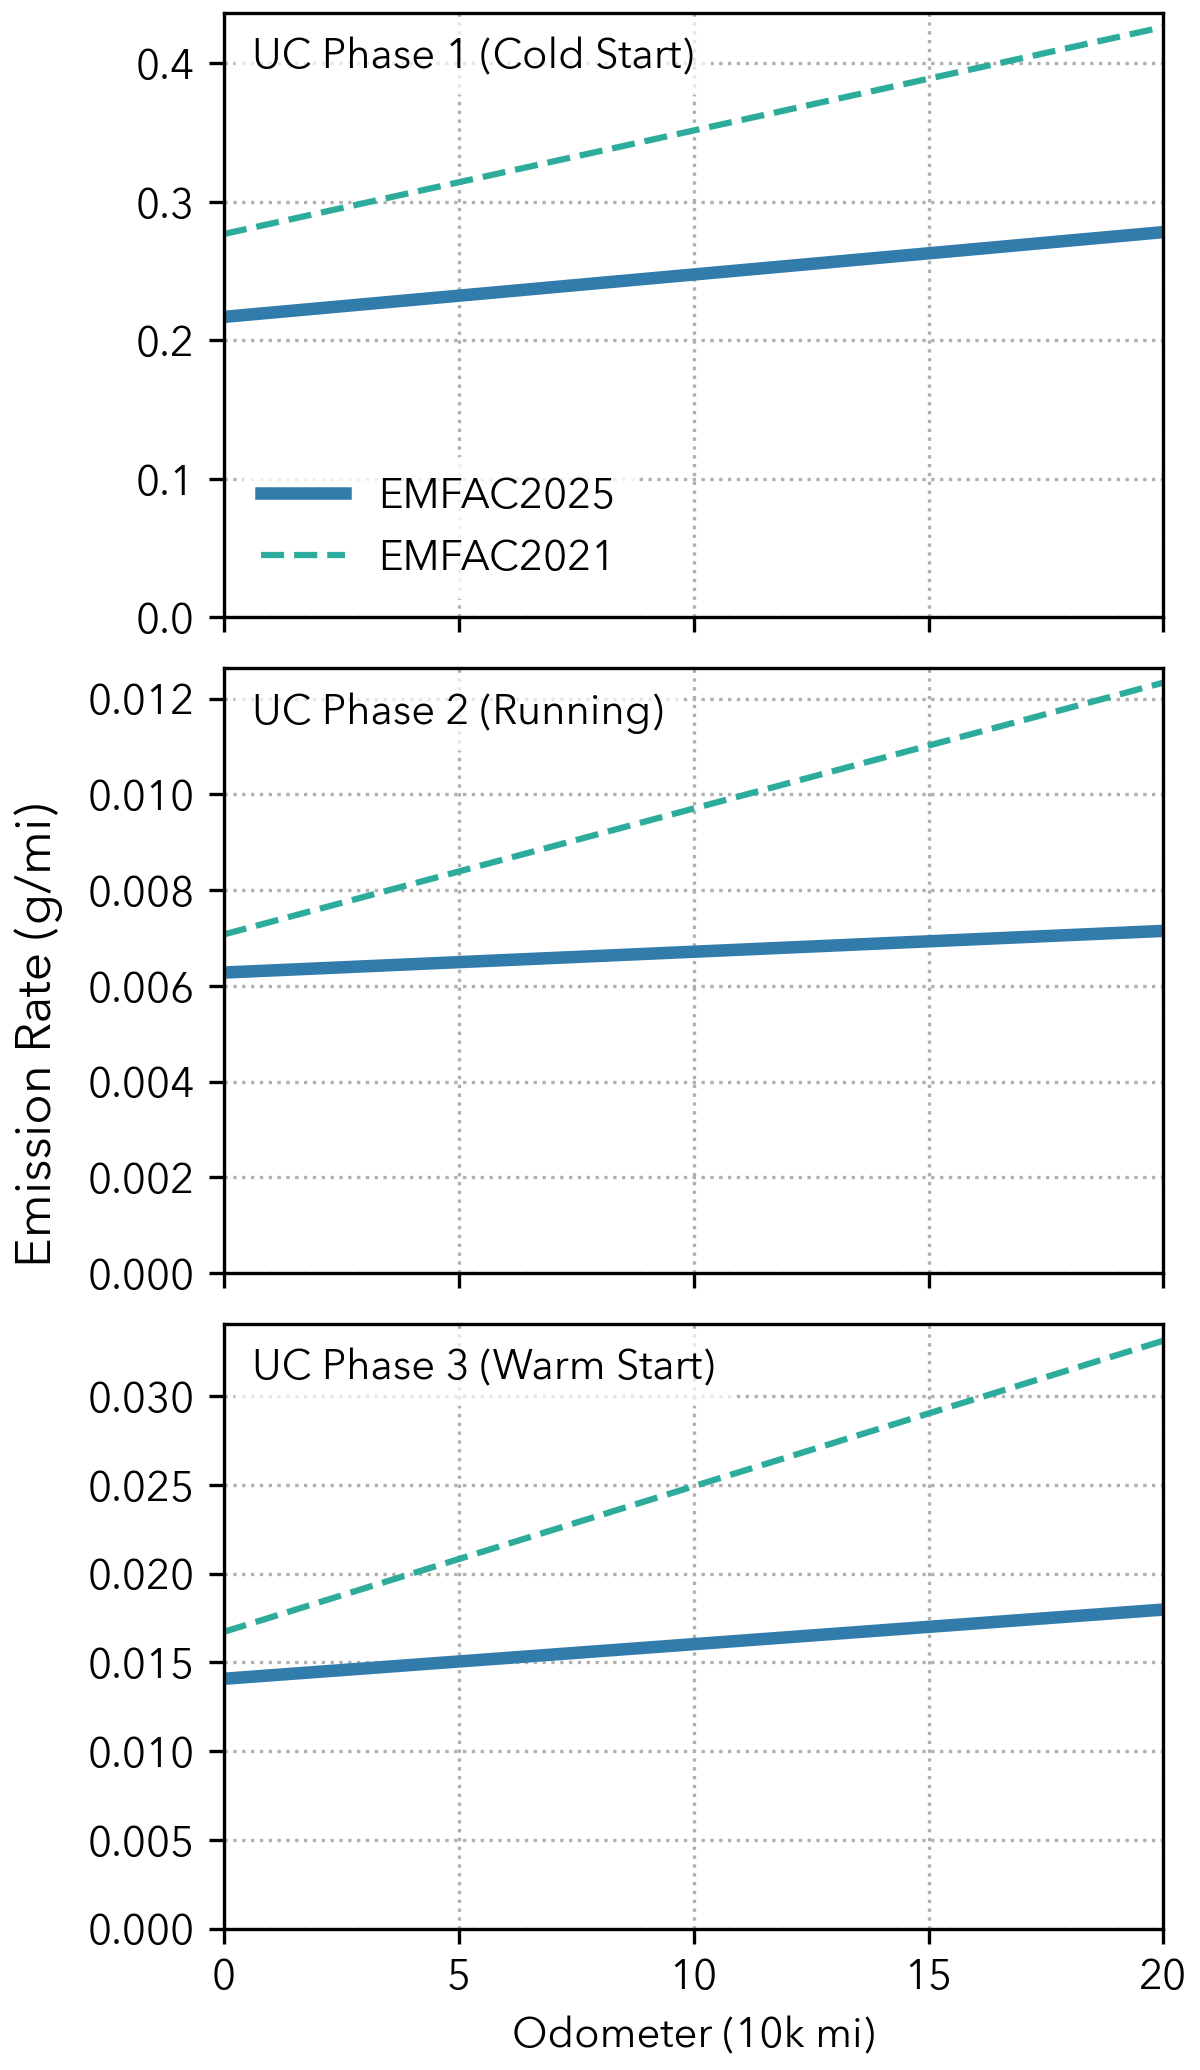
Figure 6.6: HC Emission Rates of LEV III ULEV70#
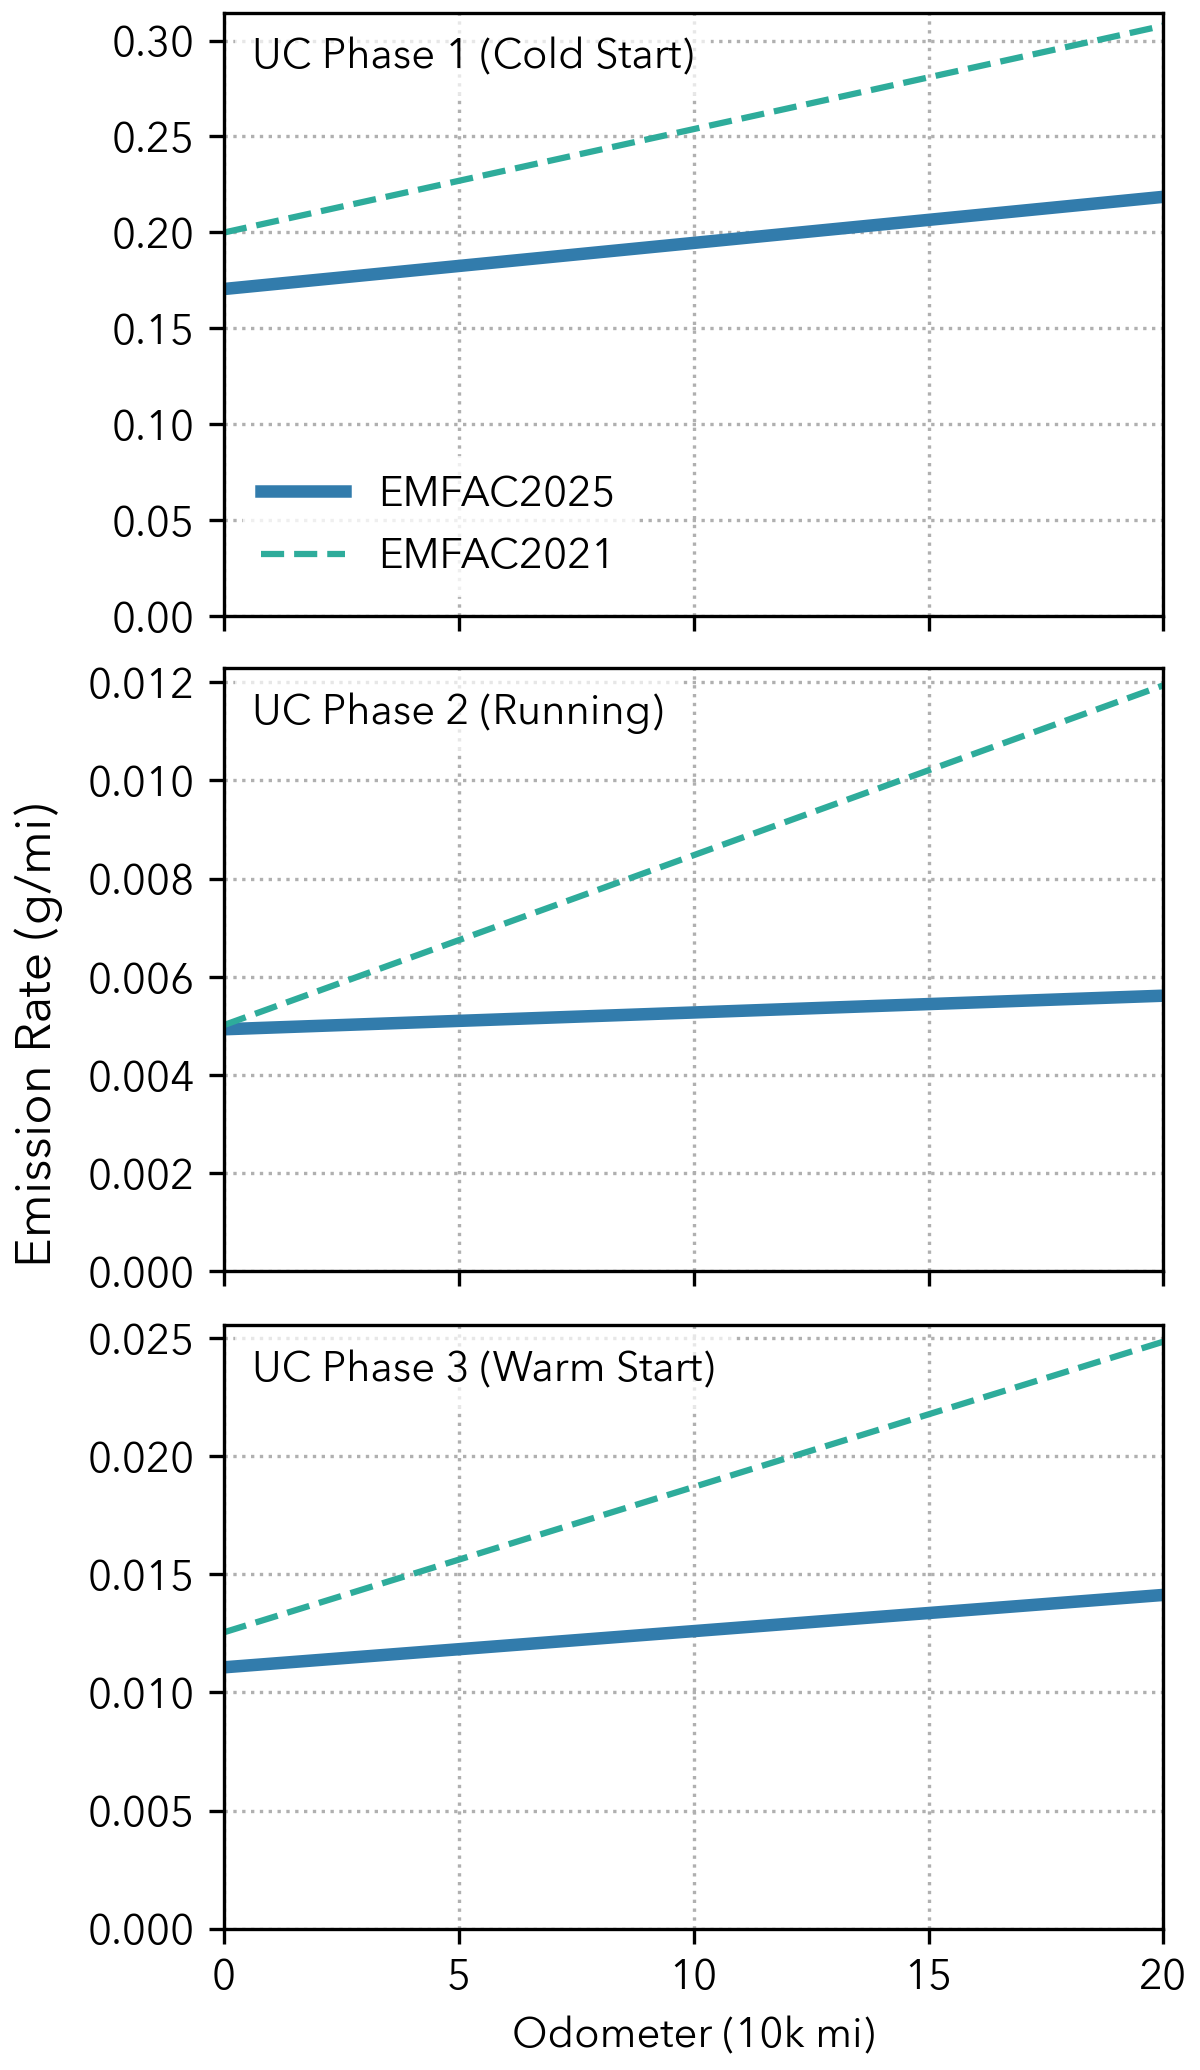
Figure 6.7: HC Emission Rates of LEV III ULEV50#
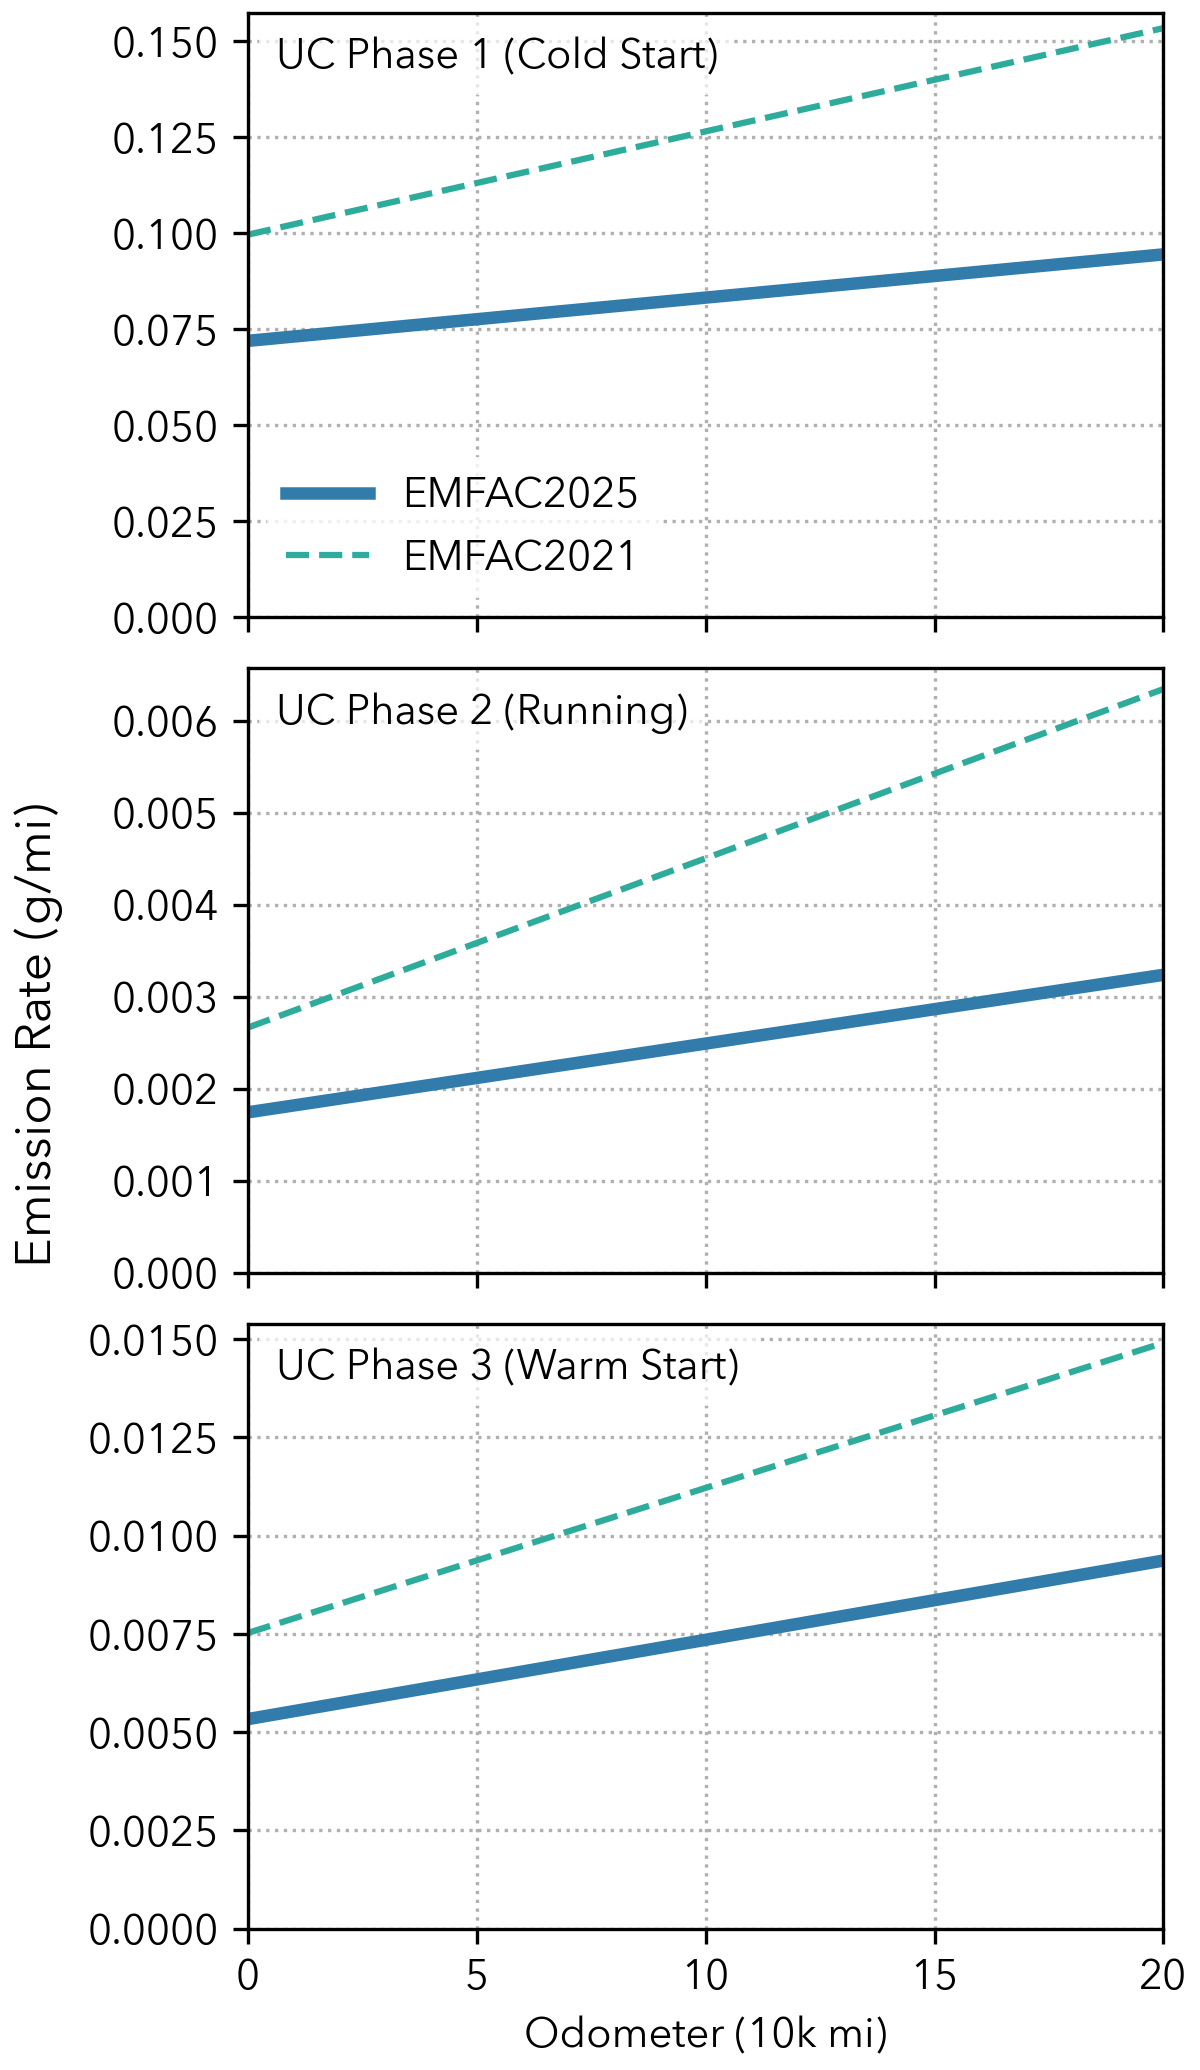
Figure 6.8: HC Emission Rates of LEV III SULEV20#
Figures 6.9 to 6.11 compare cold start, running, and warm start exhaust emission rates for HC for all the technology groups in EMFAC2025.
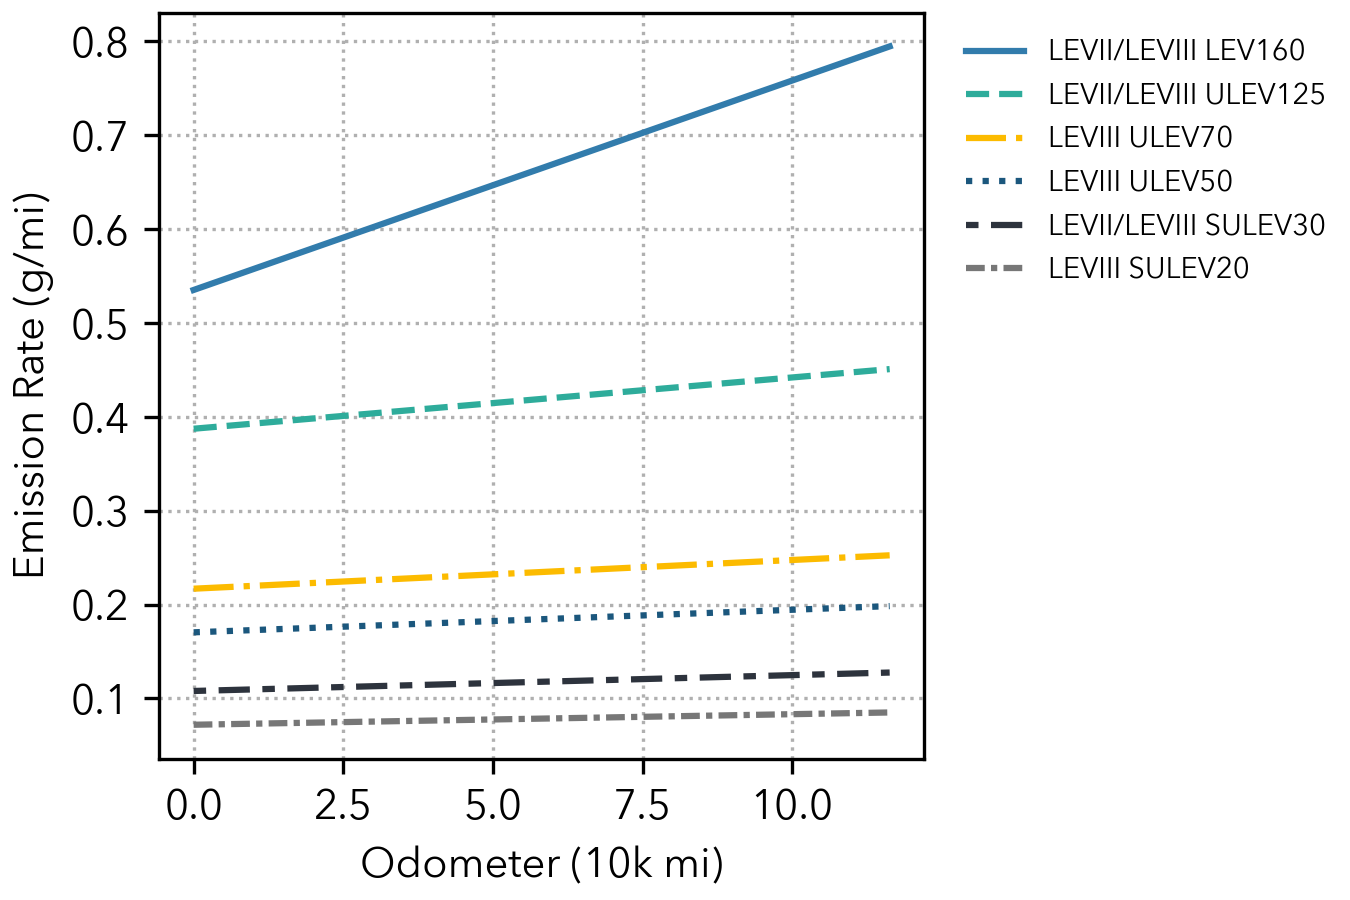
Figure 6.9: HC UC Phase 1 (Cold Start) Exhaust Emission Rates by Tech Group#
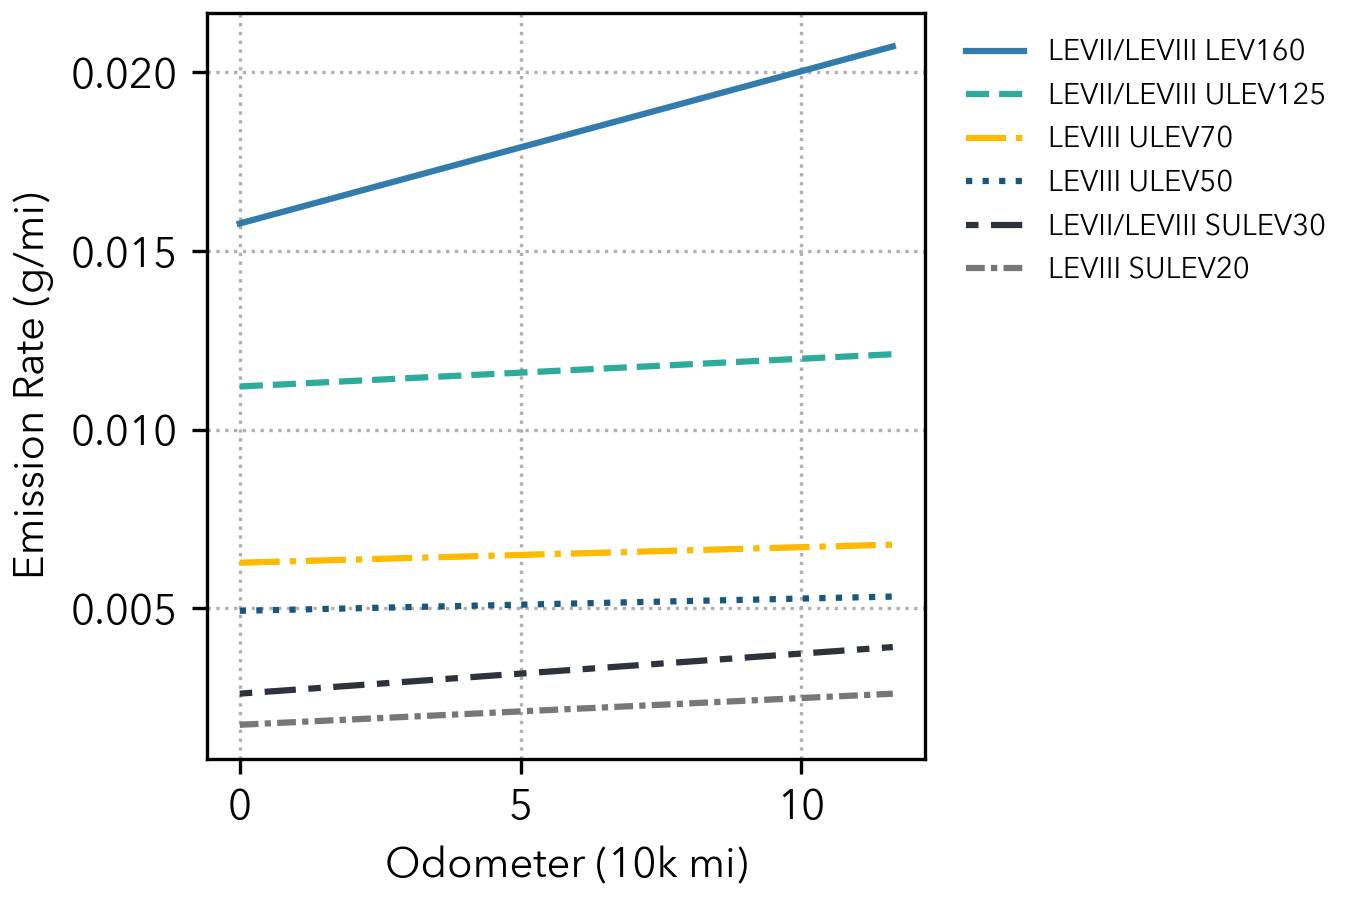
Figure 6.10: HC UC Phase 2 (Running) Exhaust Emission Rates by Tech Group#
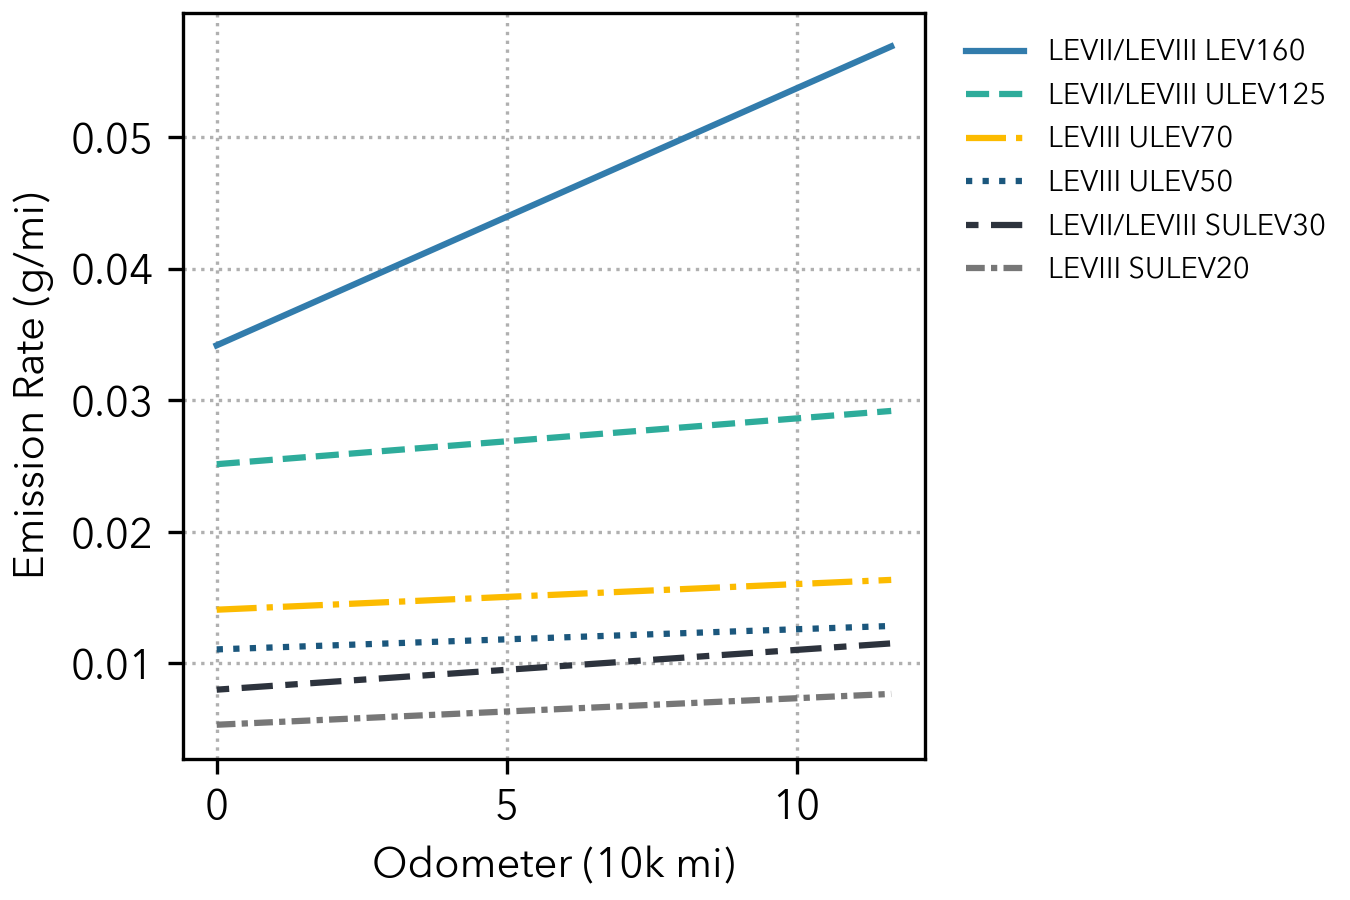
Figure 6.11: HC UC Phase 3 (Warm Start) Exhaust Emission Rates by Tech Group#
6.1.2. Oxides of Nitrogen (NOx) Base Emission Rates#
Figures 6.12 through 6.19 present comparisons of NOx base emission rates between EMFAC2025 and EMFAC2021. For the LEV I LEV group, cold start, running exhaust, and warm start NOx emission rates are higher in EMFAC2025, as shown in Figure 6.12. Similarly, cold start NOx emission rates are higher in the LEV I ULEV group in EMFAC2025, as seen in Figure 6.13. However, for running exhaust NOx emissions in LEV I ULEV, rates are lower at lower odometer readings and higher at higher odometer readings in EMFAC2025, as shown in Figure 6.13. Warm start NOx emissions are mostly lower in EMFAC2025 than in EMFAC2021, as indicated in Figure 6.13. As shown in Figures 6.14 to 6.19, cold start NOx emission rates are lower across all LEV II and LEV III technology groups in EMFAC2025 compared to EMFAC2021, except for LEV II LEV160, for which the cold start NOx emission rates are lower at low odometer readings and higher at higher odometer readings. Figures 6.14 to 6.19 show that running exhaust NOx emissions are generally lower in EMFAC2025 across most LEV II and LEV III groups, with reduced deterioration at higher odometer readings, particularly for ULEV70, ULEV50, SULEV30, and SULEV20. The LEV160 group shows lower NOx base emission rates at low odometer readings and higher rates at higher odometer readings. The ULEV125 group shows higher NOx running exhaust rates at lower odometer readings and lower rates at higher odometer readings. Warm start NOx emission rates are also lower across all LEV II and LEV III technology groups in EMFAC2025 compared to EMFAC2021, except LEV II LEV160, as illustrated in Figures 6.14 to 6.19. The LEV II LEV160 group shows higher warm start NOx emission rates than EMFAC2021.
Figures 6.12 to 6.19 compare cold start, running, and warm start exhaust emission rates for NOx for all the technology groups in EMFAC2025.
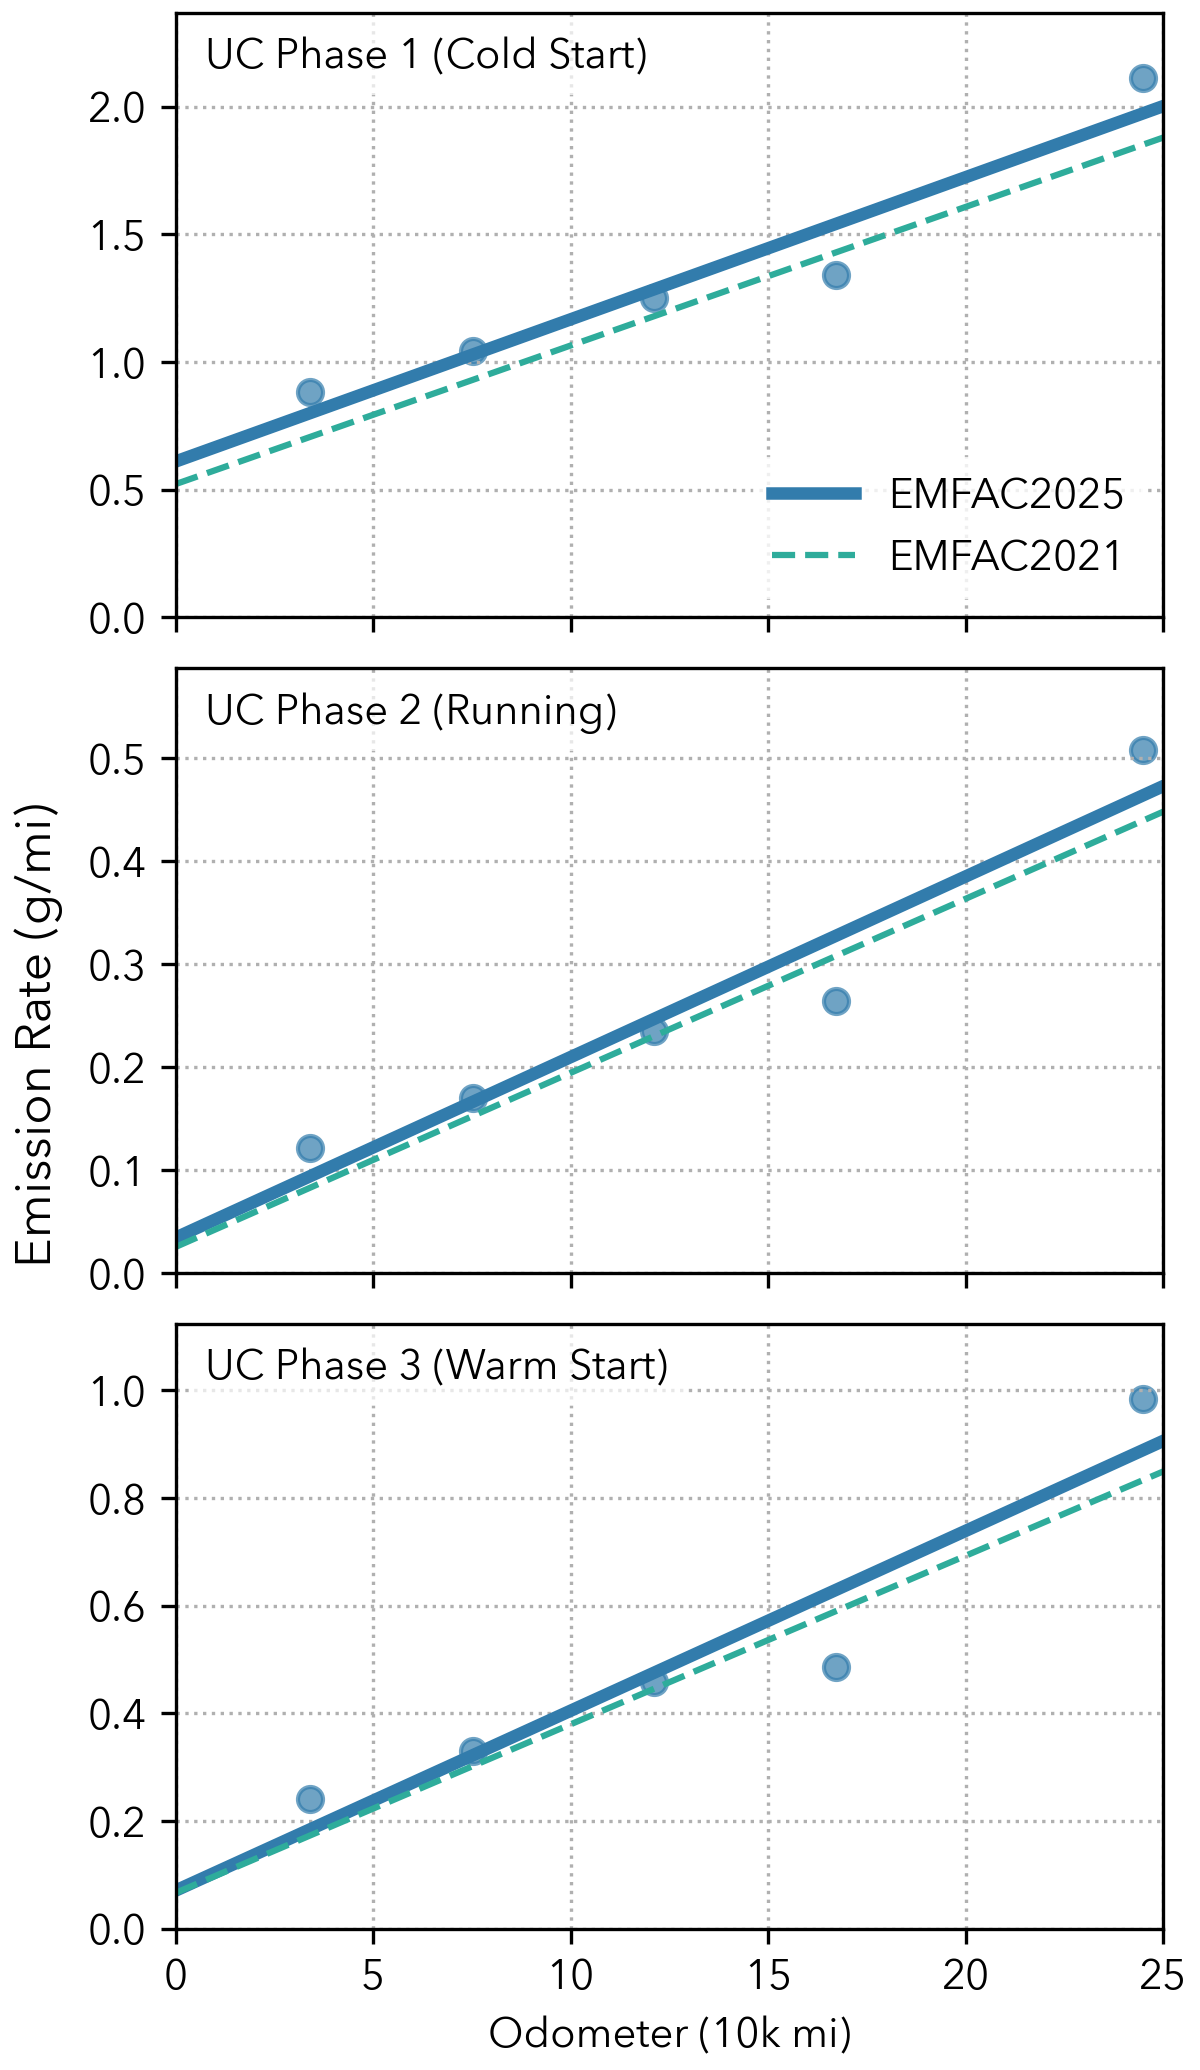
Figure 6.12: NOx Emission Rates of LEV I LEV#
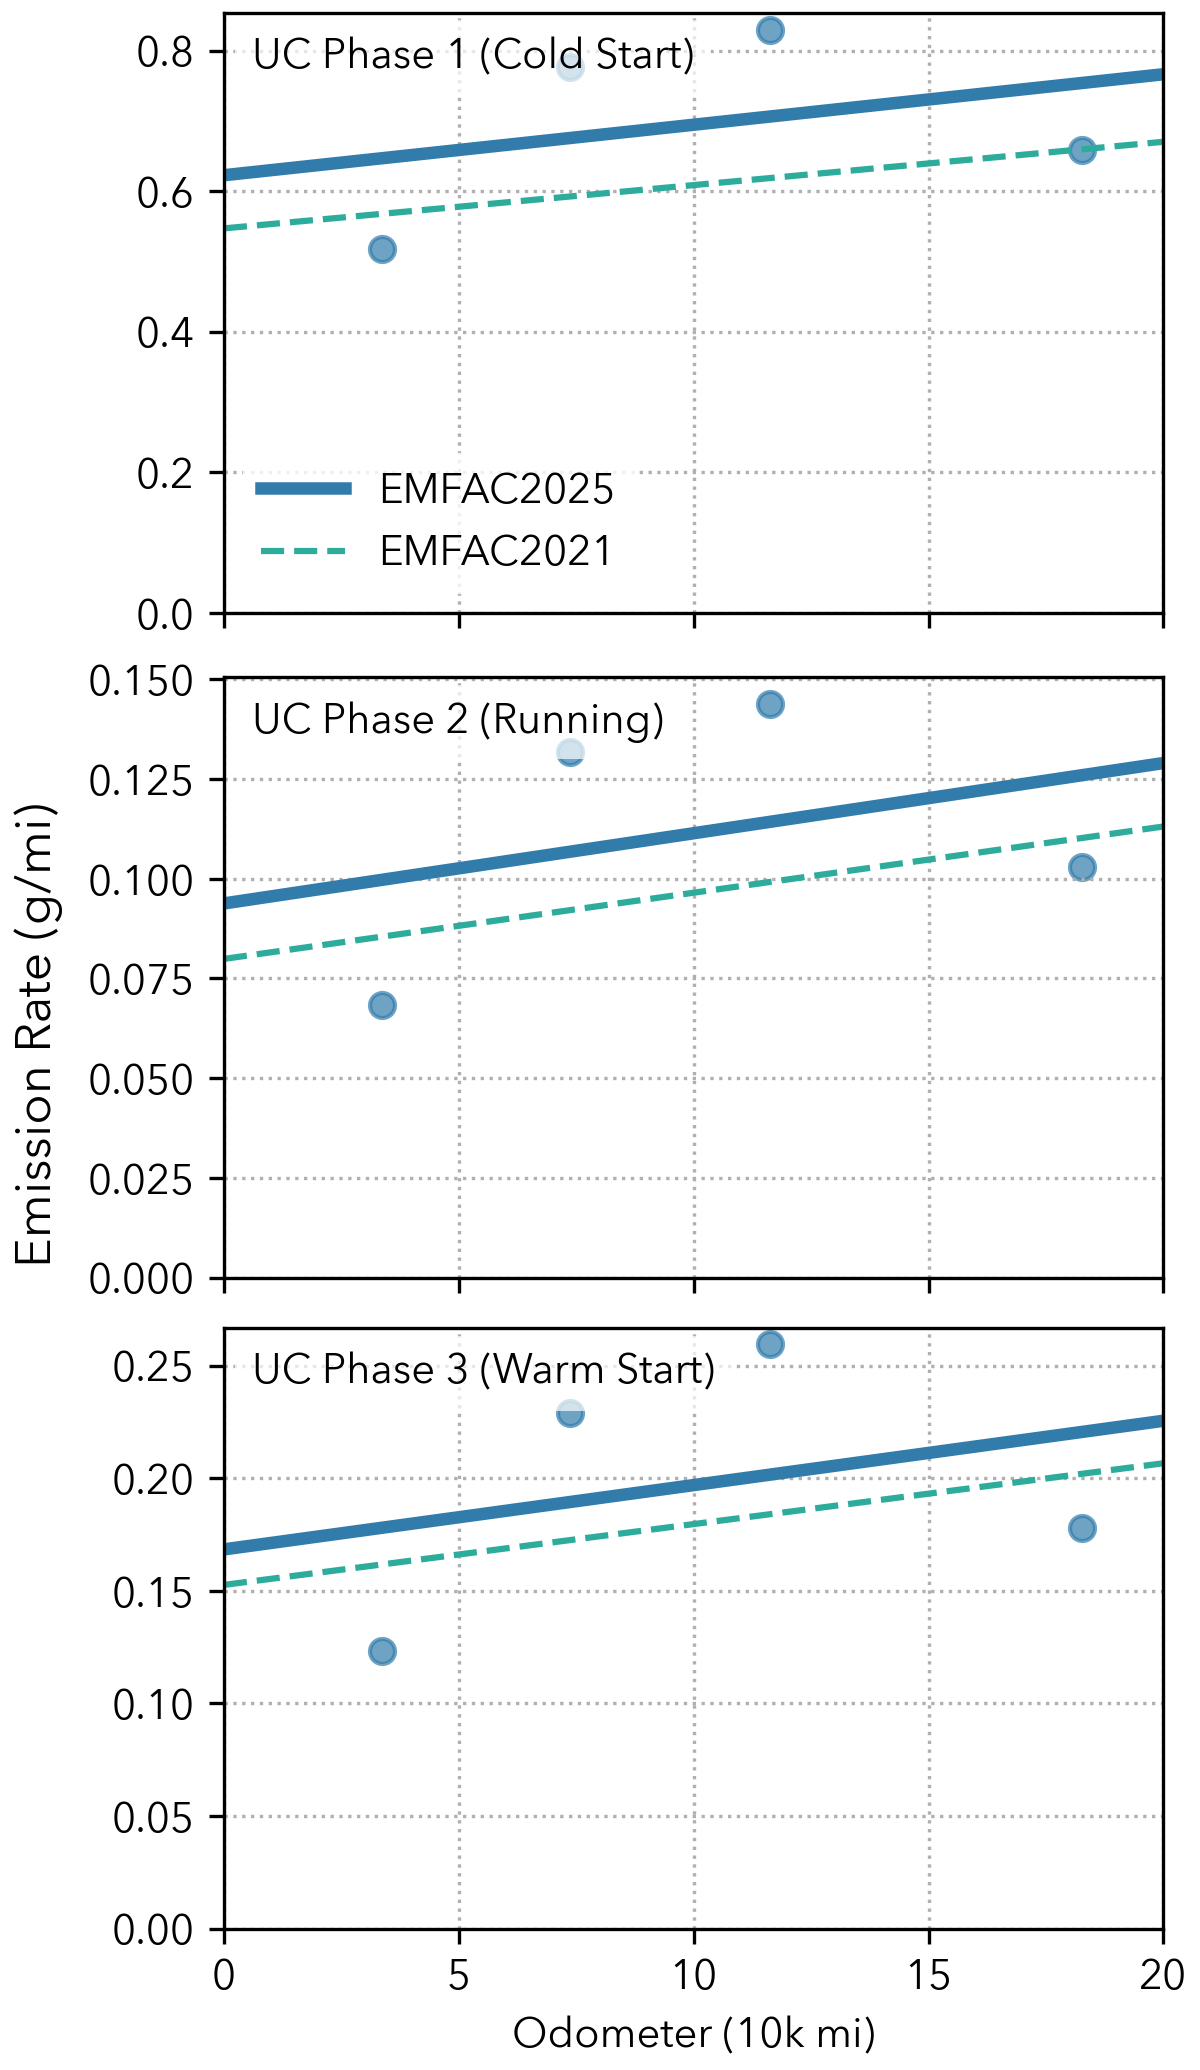
Figure 6.13: NOx Emission Rates of LEV I ULEV#
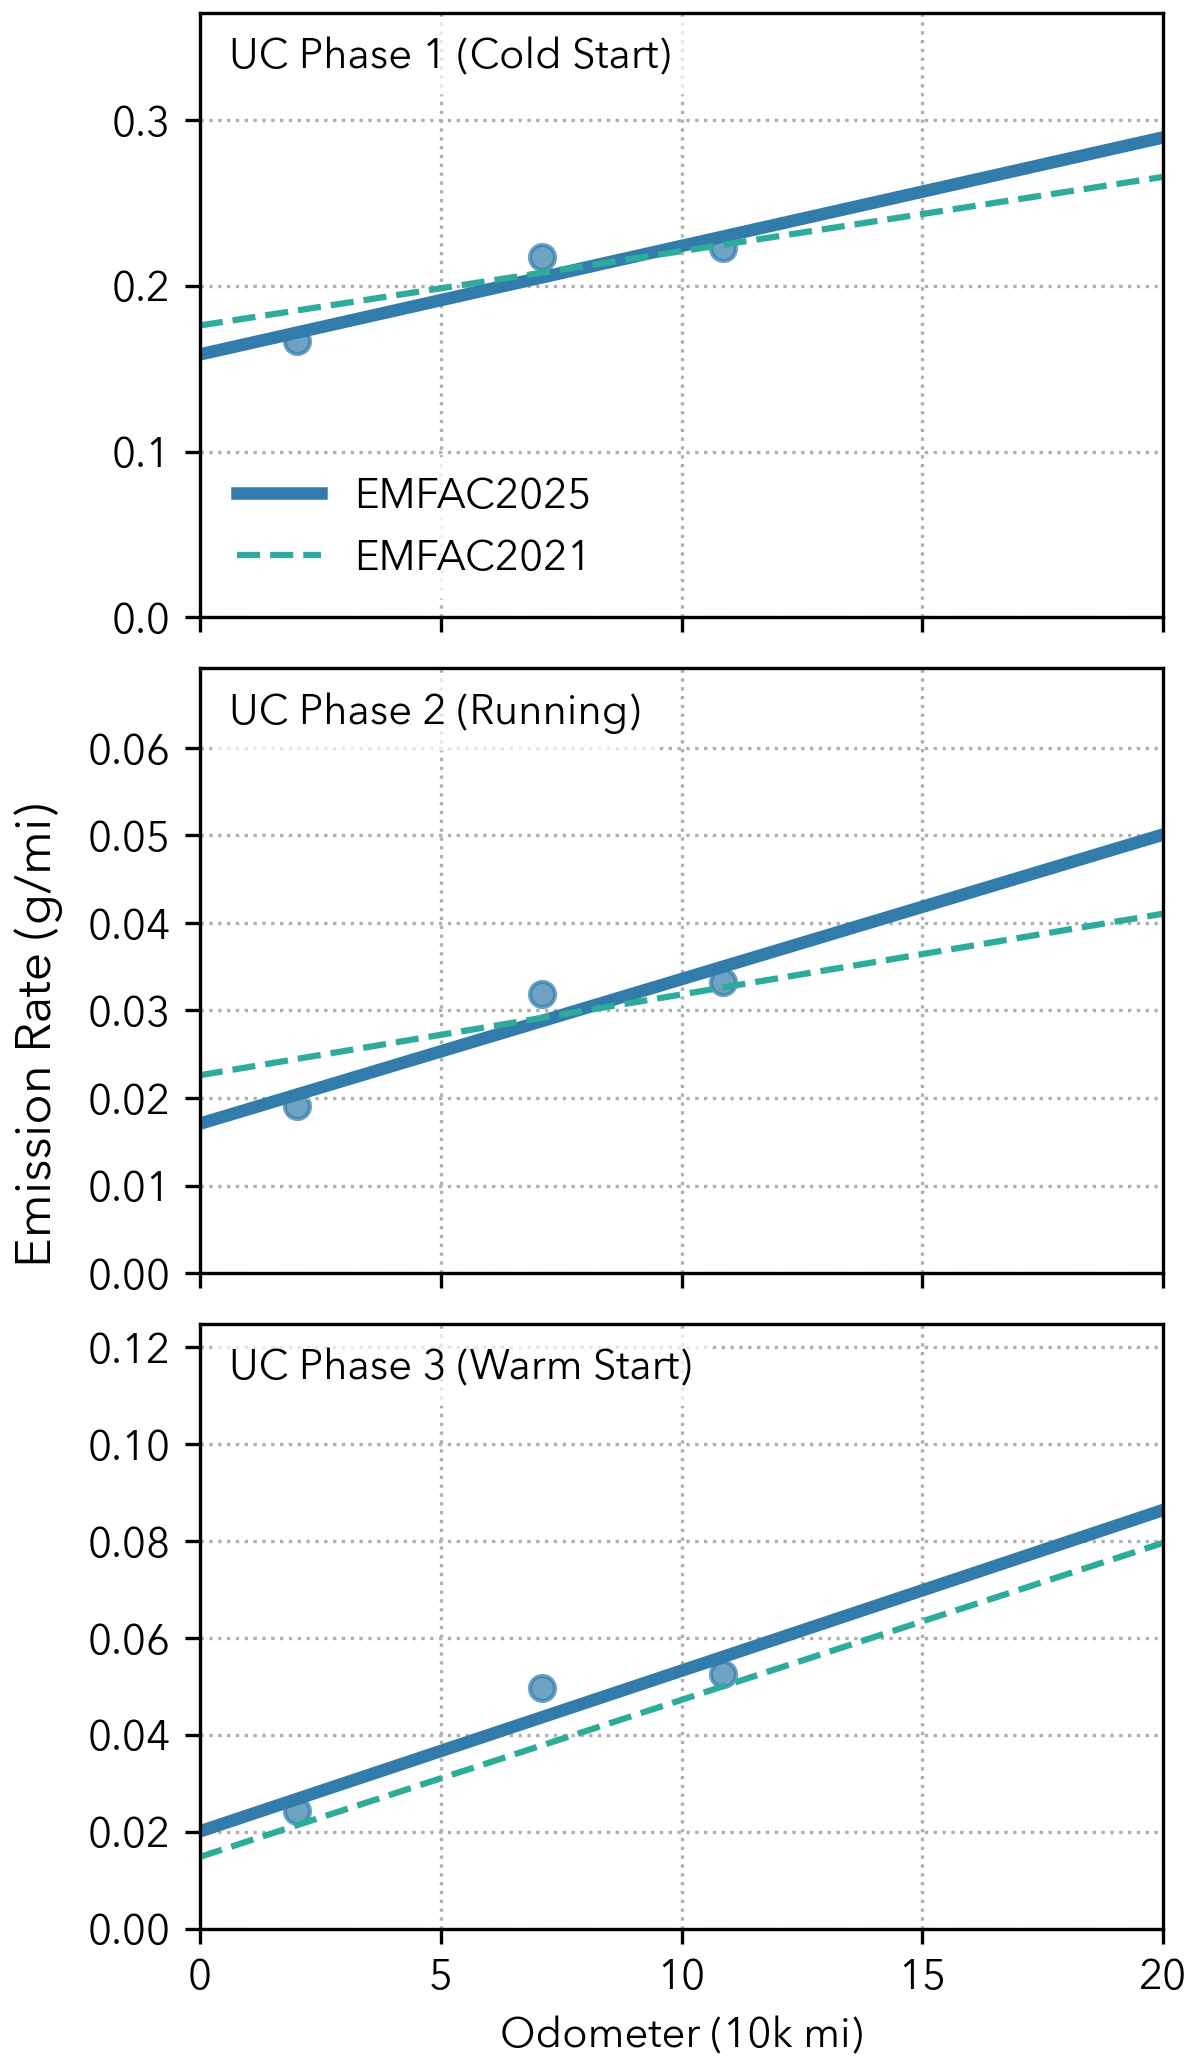
Figure 6.14: NOx Emission Rates of LEV II/LEV III LEV160#
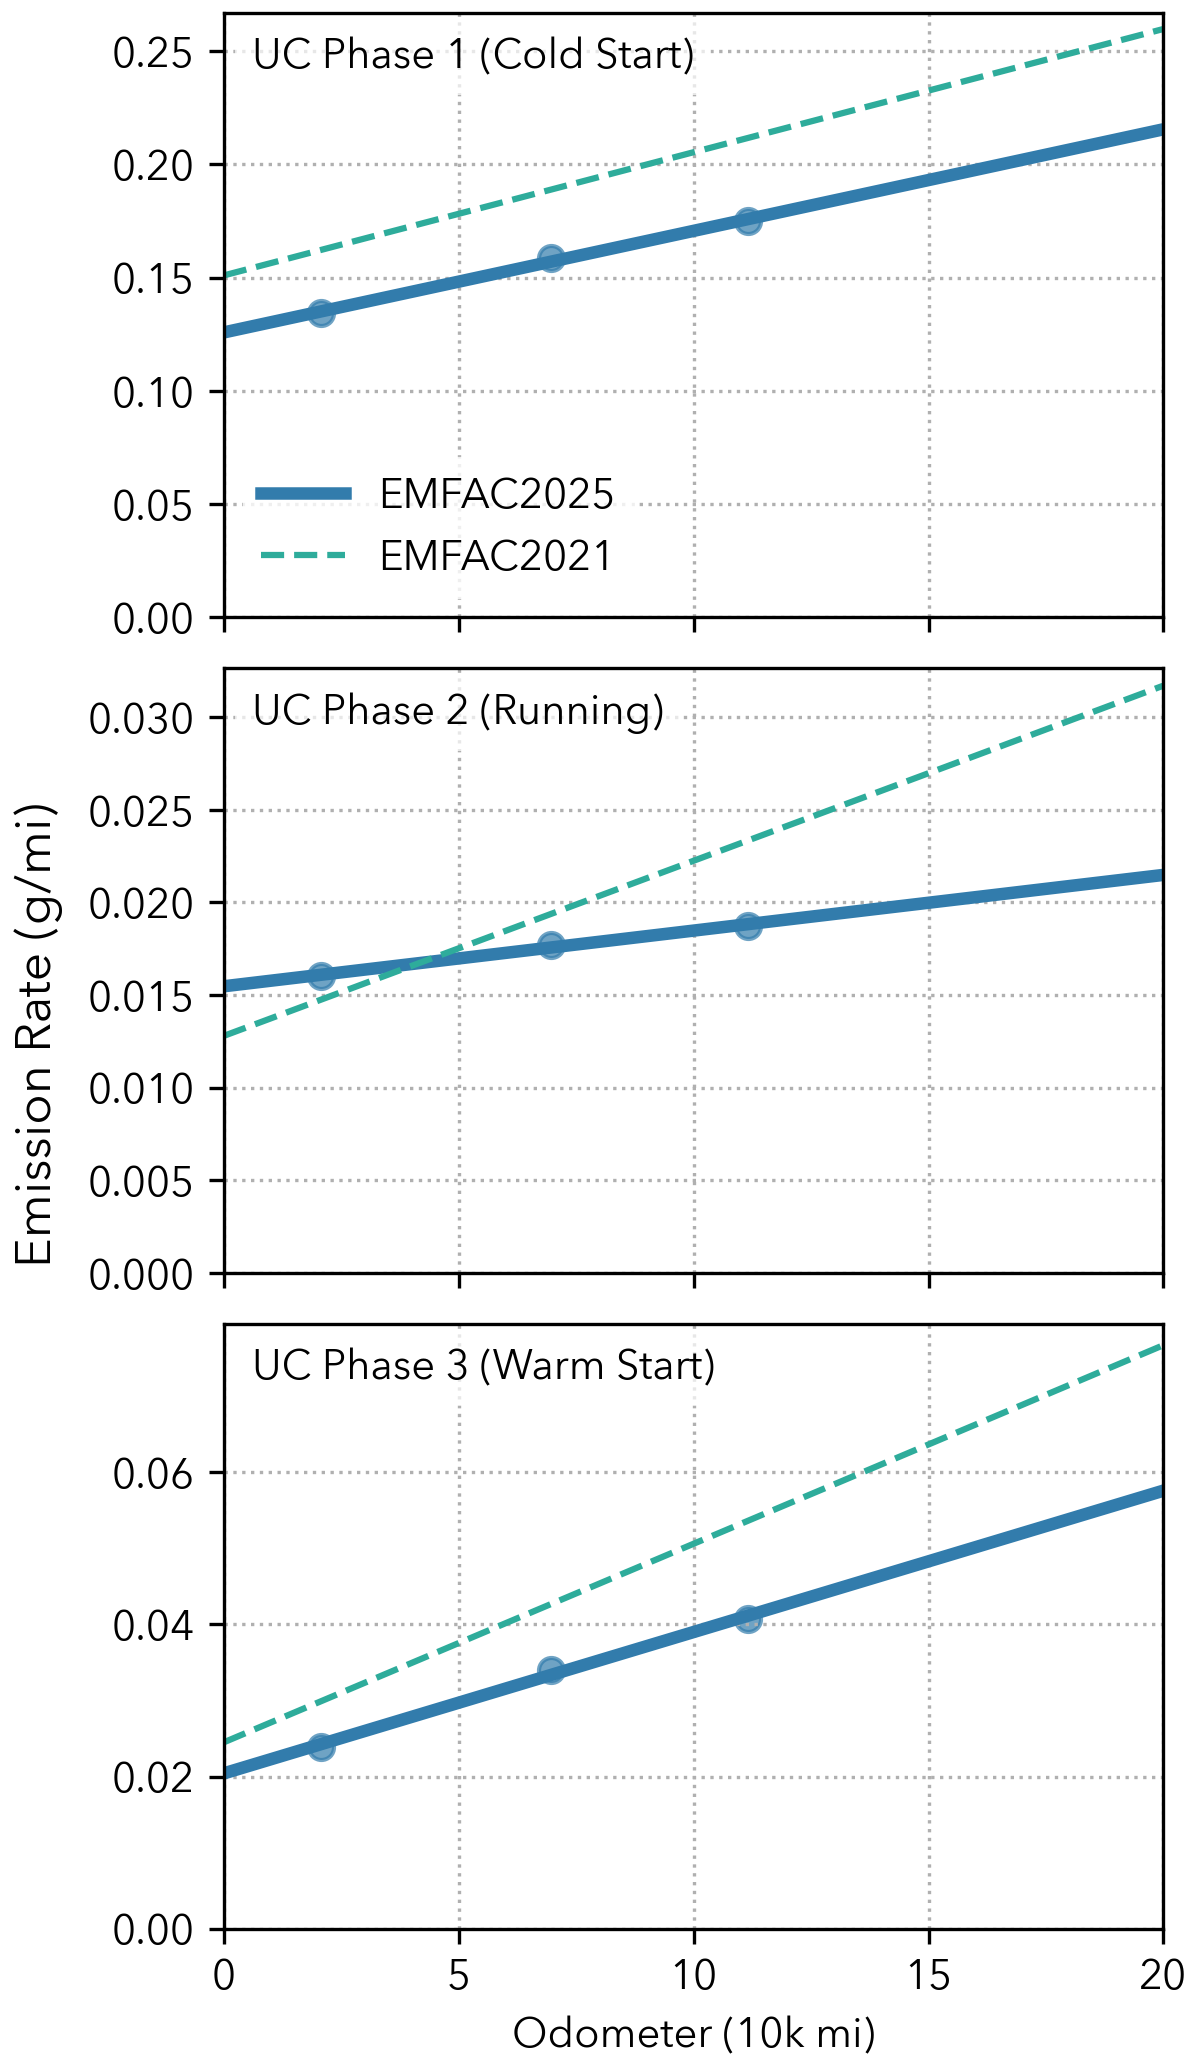
Figure 6.15: NOx Emission Rates of LEV II/LEV III ULEV125#
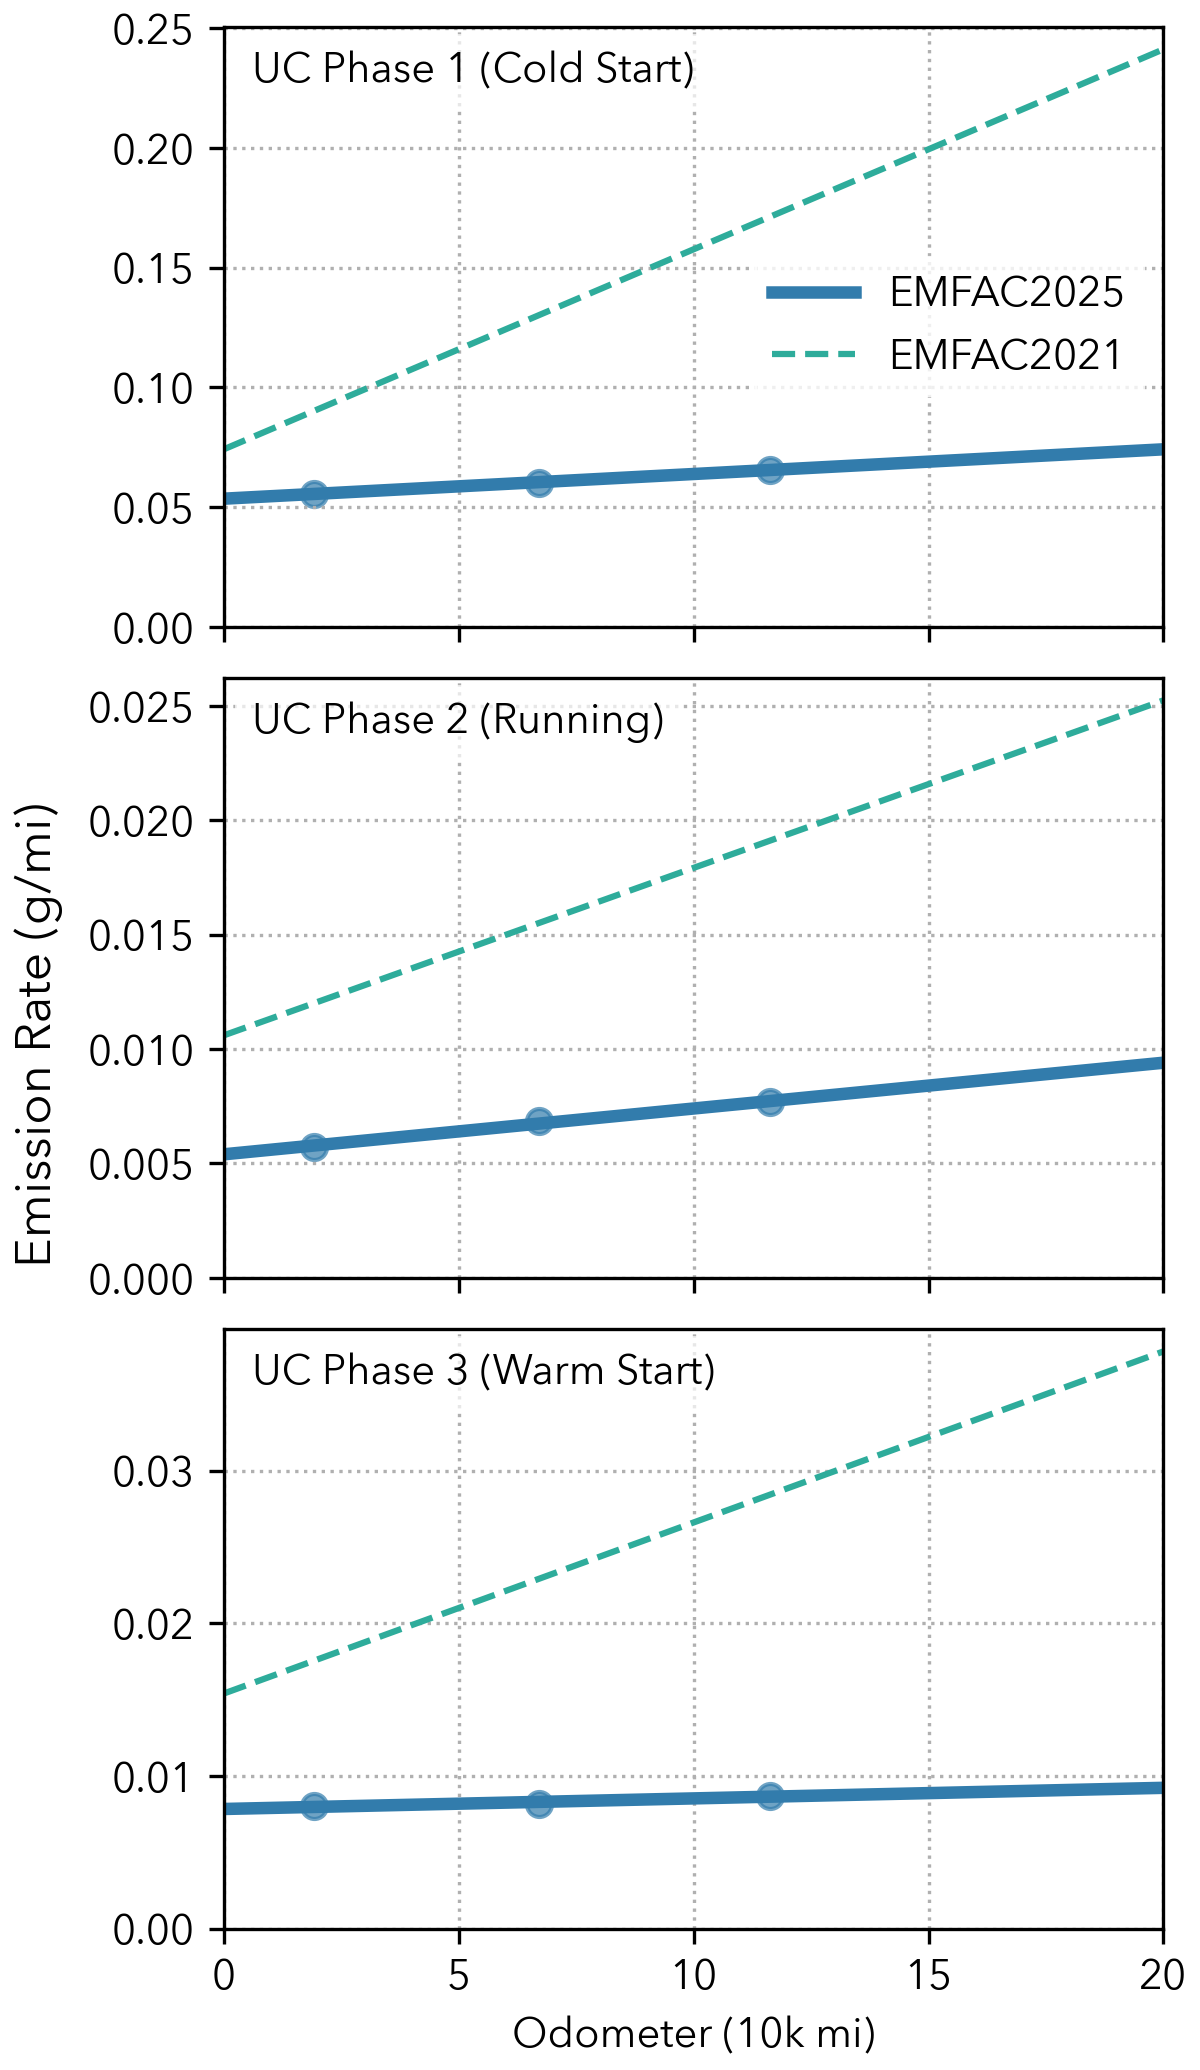
Figure 6.16: NOx Emission Rates of LEV II/LEV III SULEV30#
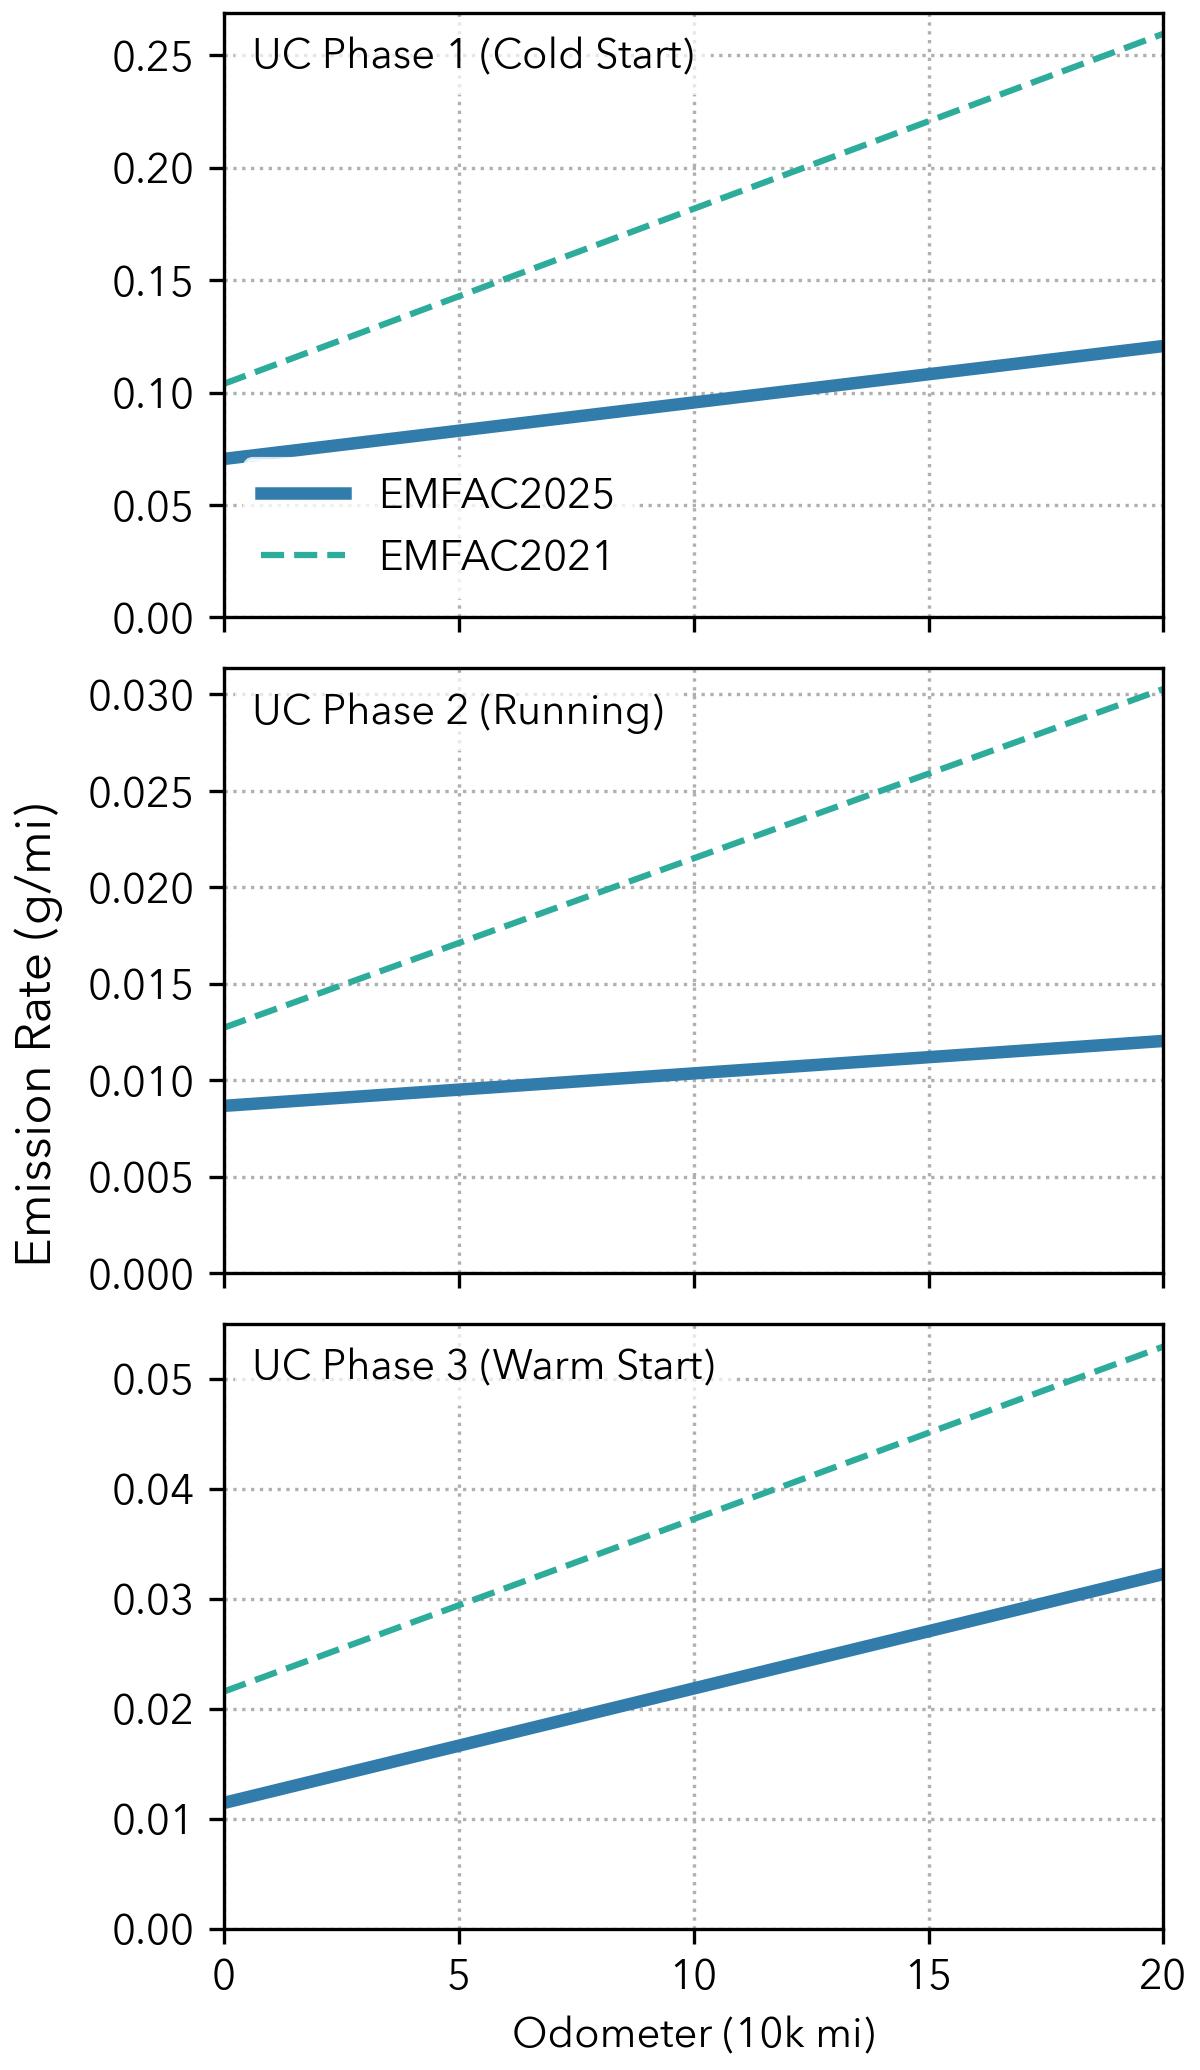
Figure 6.17: NOx Emission Rates of LEV III ULEV70#
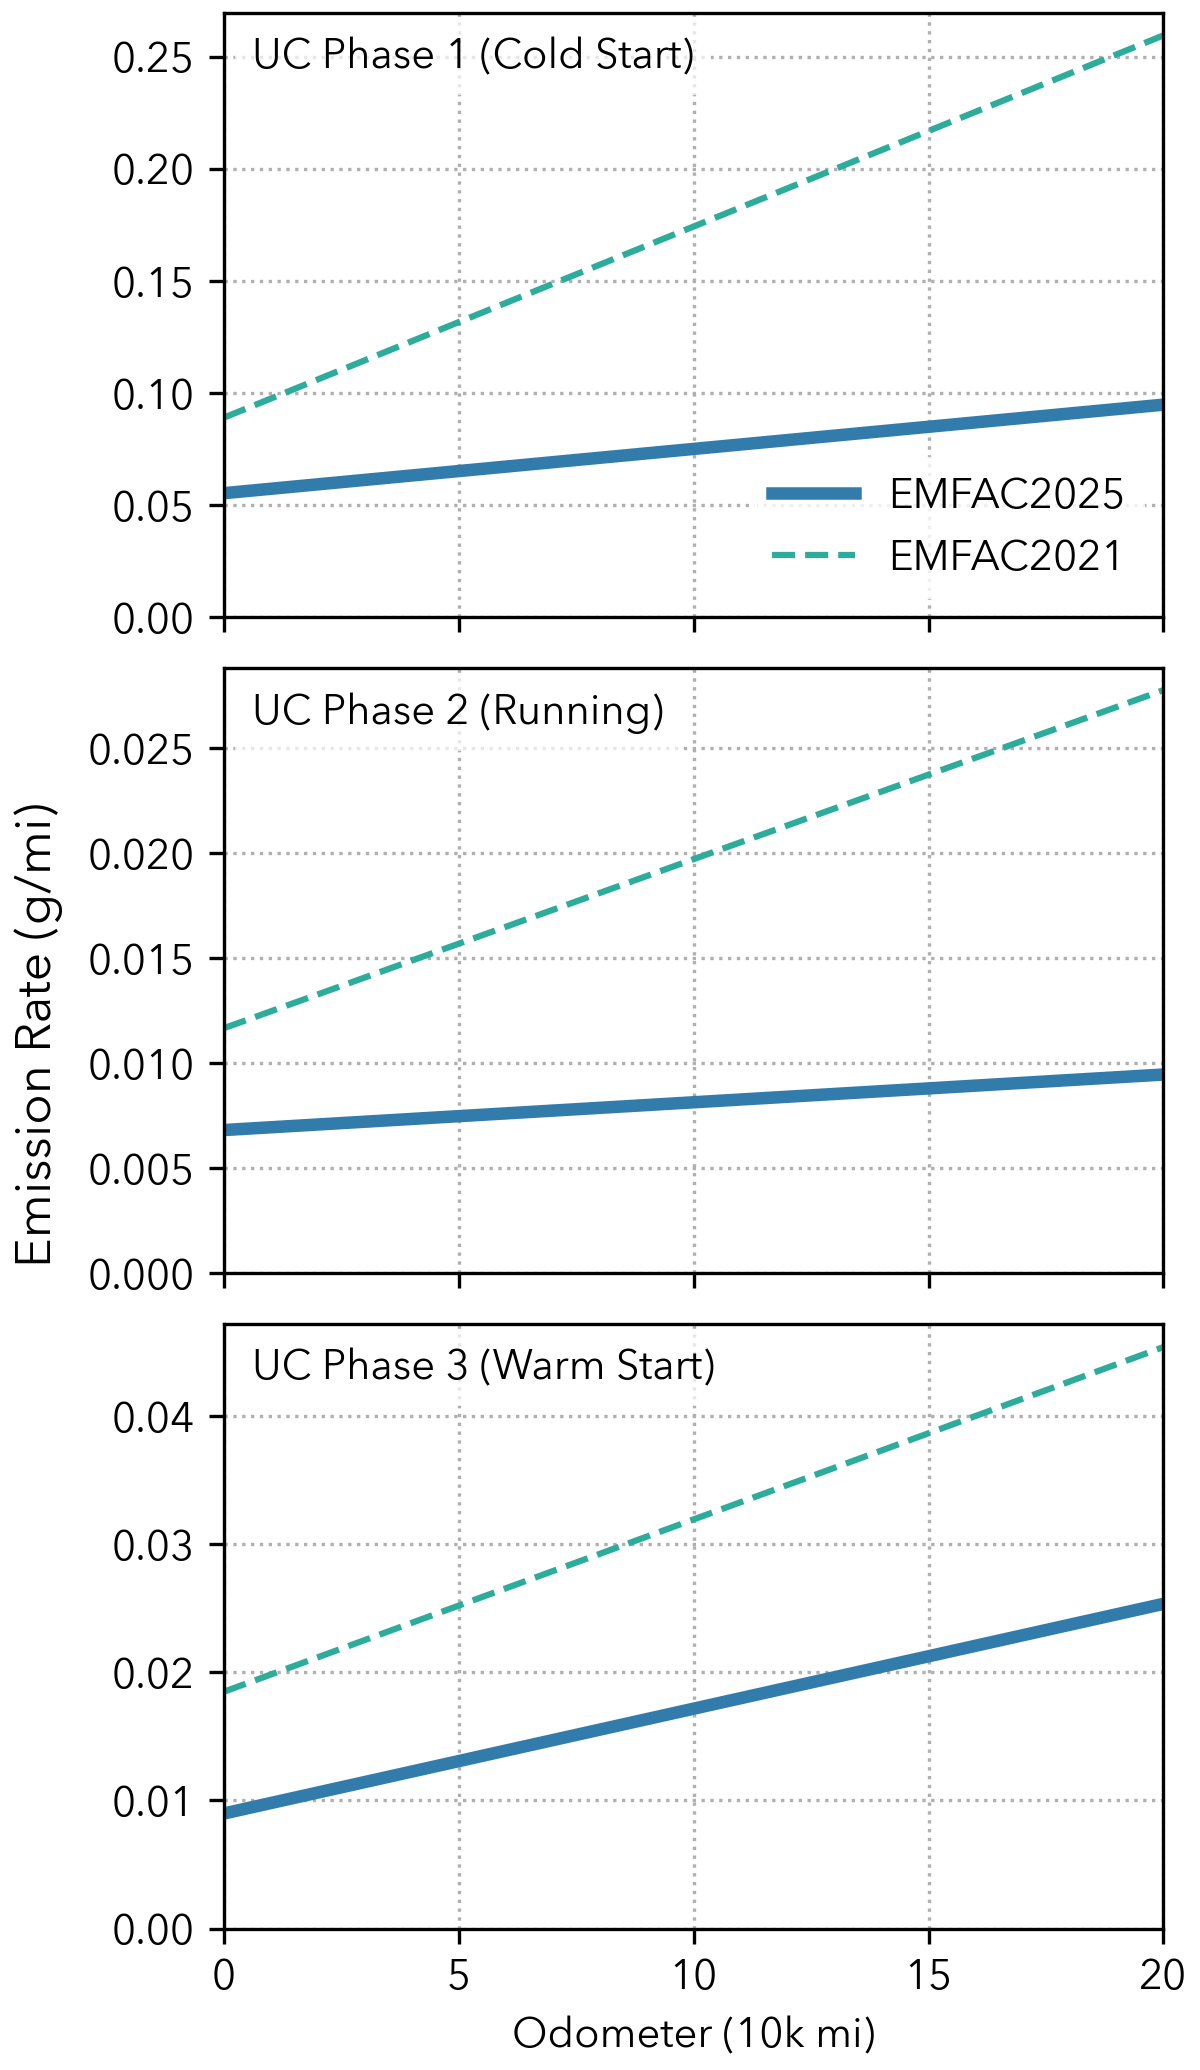
Figure 6.18: NOx Emission Rates of LEV III ULEV50#
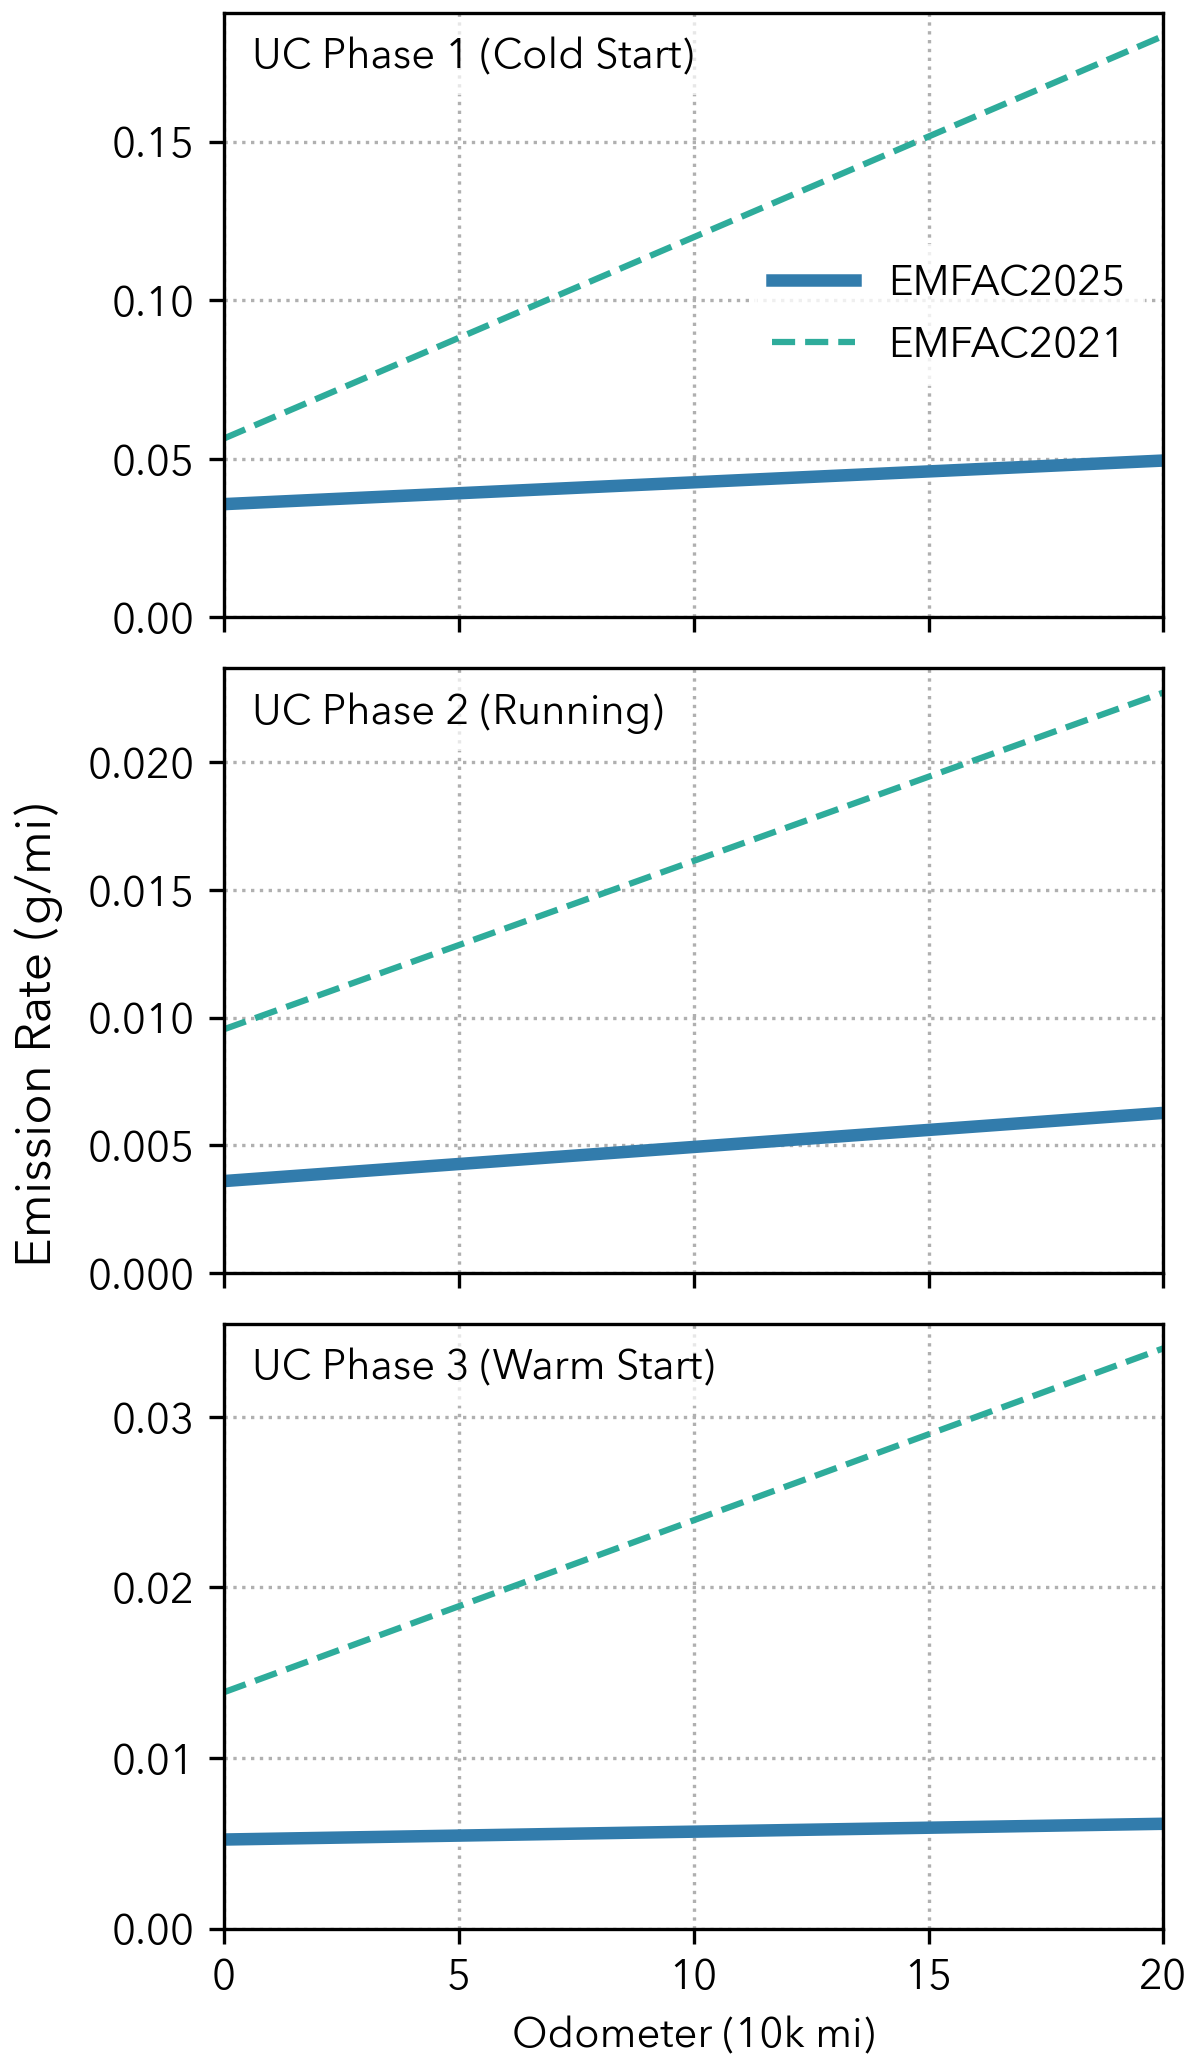
Figure 6.19: NOx Emission Rates of LEV III SULEV20#
Figures 6.20, 6.21, and 6.22 compare the cold start, running, and warm start exhaust emission rates for NOx for all the technology groups in EMFAC2025, respectively.
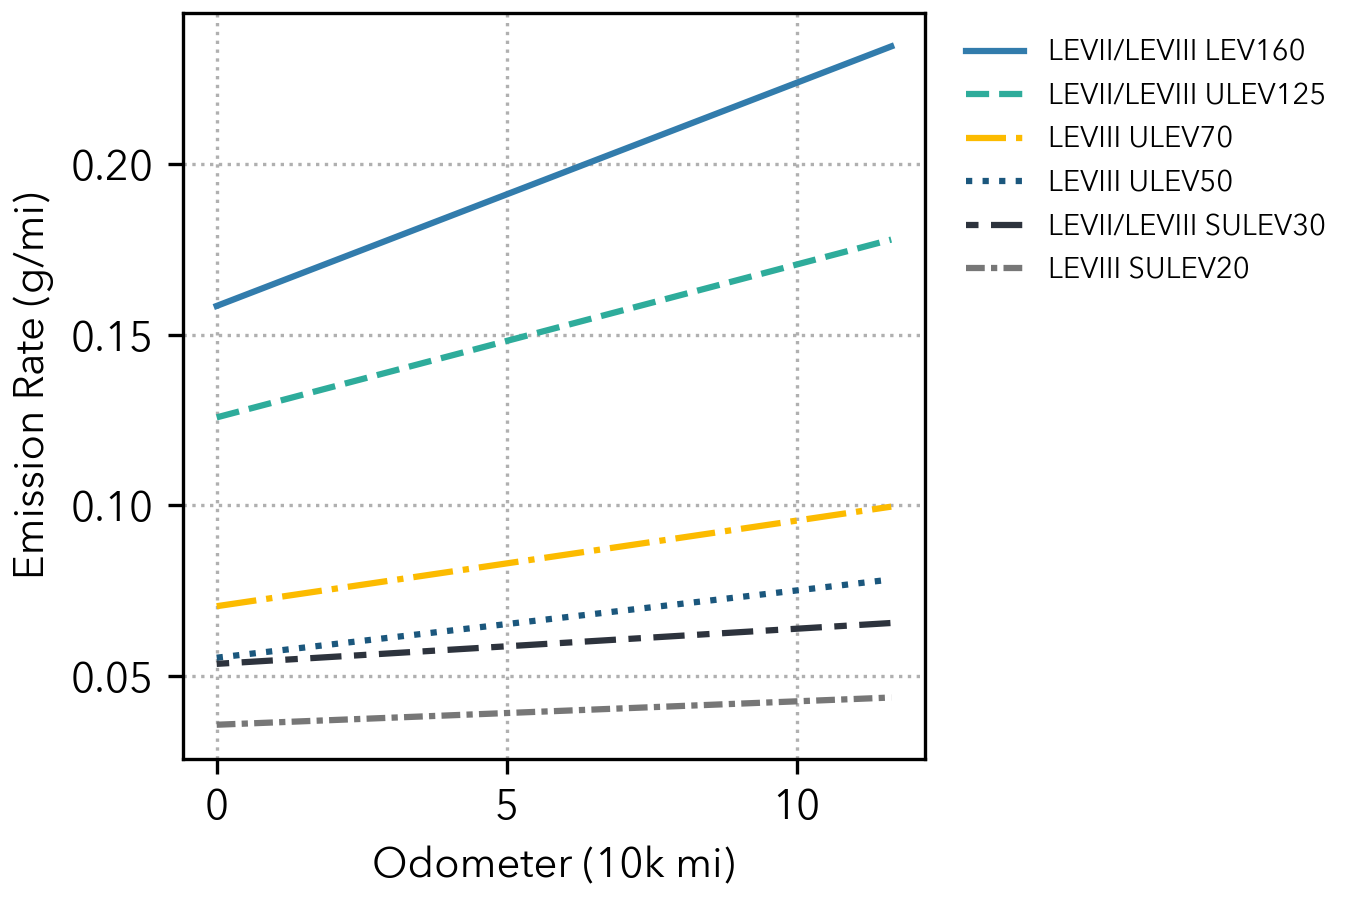
Figure 6.20: NOx UC Phase 1 (Cold Start) Exhaust Emission Rates by Tech Group#
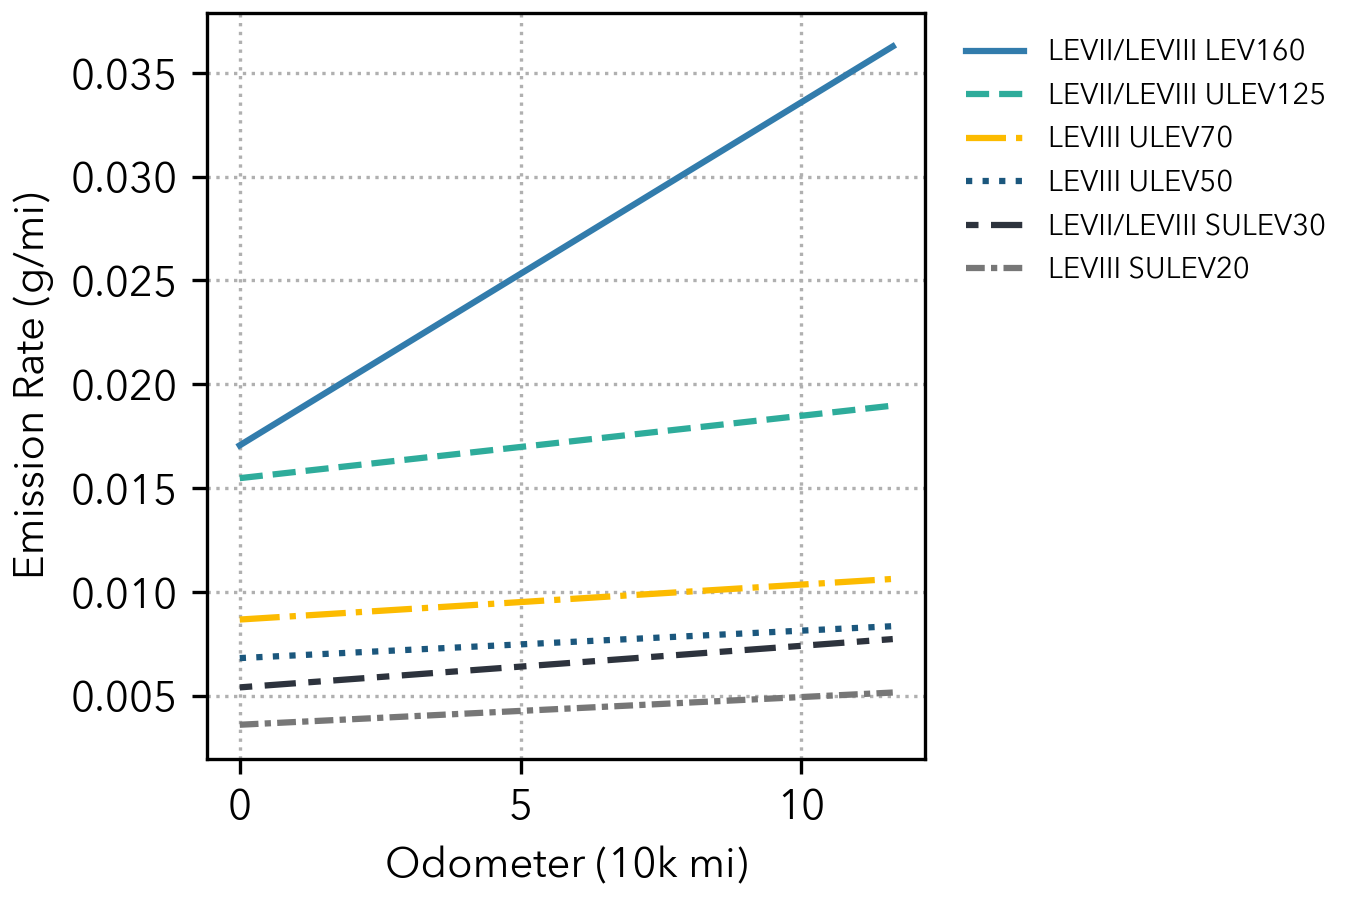
Figure 6.21: NOx UC Phase 2 (Running) Exhaust Emission Rates by Tech Group#
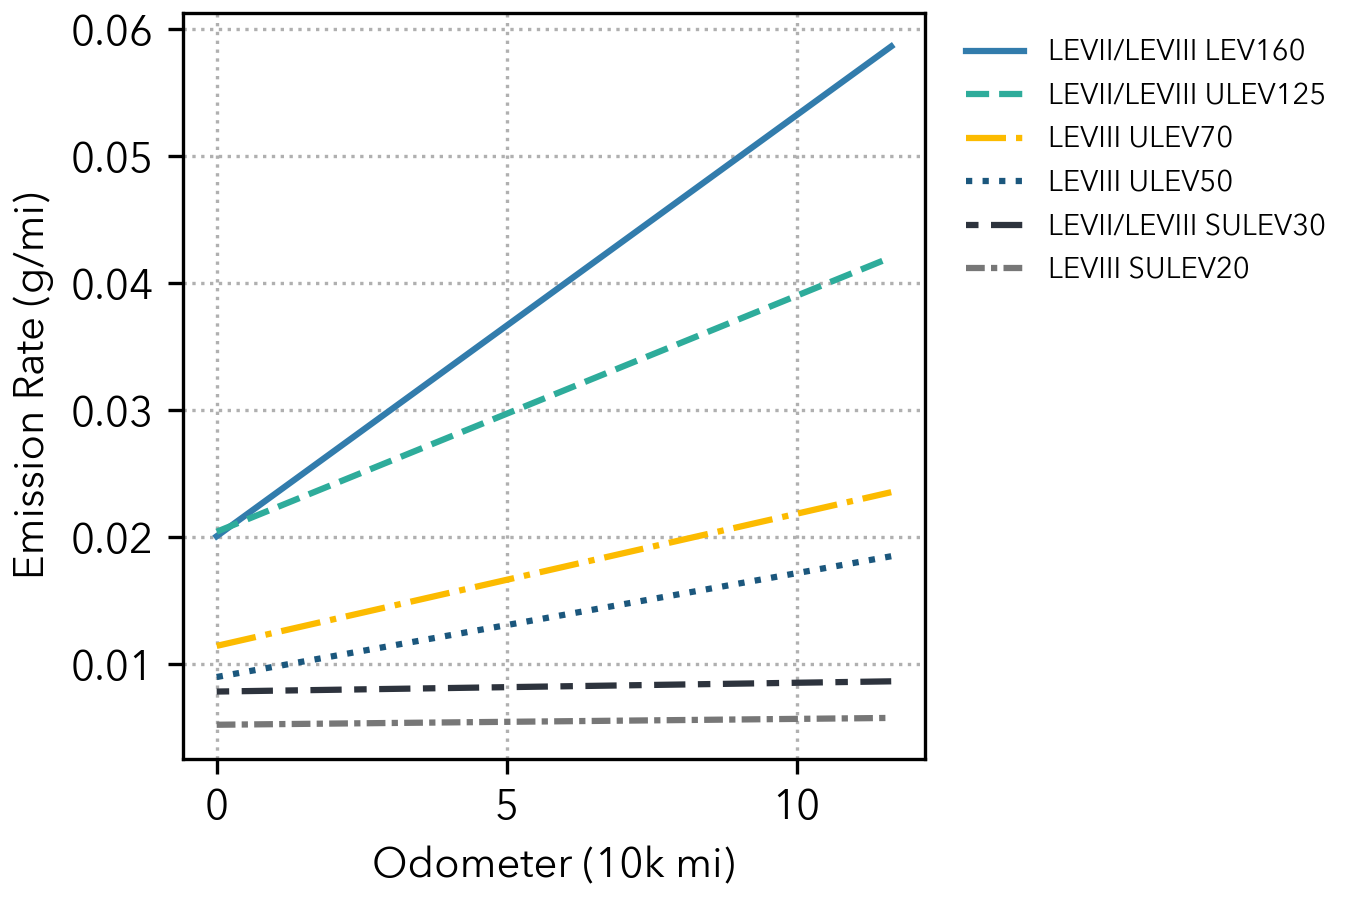
Figure 6.22: NOx UC Phase 3 (Warm Start) Exhaust Emission Rates by Tech Group#
6.1.3. Base Emission Rate Regression Equations#
Tables 6.6 to 6.10 provide the final regression equations utilized in EMFAC2025 for light-duty BERs. They are listed by Tech Group IDs, which are numerical identifiers for technology groups in the EMFAC model. Each technology group represents vehicles with distinct emission control technologies and similar in-use deterioration. Note that the BER for the LEV III ULEV70, LEV III ULEV50, and LEV III SULEV20 technology groups are calculated by scaling with the ROS scalar, as previously described, and share the regression equations with their corresponding LEV II base groups.
Process |
Pollutant |
Regression Equation |
|---|---|---|
UC Phase 1 (Cold Start) |
HC |
\(y = 5.49 \cdot 10^{-6}x + 0.919\) |
CO |
\(y = 4.11 \cdot 10^{-5}x + 10.42\) |
|
NOx |
\(y = 5.56 \cdot 10^{-6}x + 0.610\) |
|
UC Phase 2 (Running) |
HC |
\(y = 4.16 \cdot 10^{-7}x + 0.018\) |
CO |
\(y = 9.22 \cdot 10^{-6}x + 1.597\) |
|
NOx |
\(y = 1.75 \cdot 10^{-6}x + 0.034\) |
|
UC Phase 3 (Warm Start) |
HC |
\(y = 1.30 \cdot 10^{-6}x + 0.040\) |
CO |
\(y = 1.40 \cdot 10^{-5}x + 1.178\) |
|
NOx |
\(y = 3.34 \cdot 10^{-6}x + 0.070\) |
Process |
Pollutant |
Regression Equation |
|---|---|---|
UC Phase 1 (Cold Start) |
HC |
\(y = 4.15 \cdot 10^{-7}x + 0.881\) |
CO |
\(y = 1.77 \cdot 10^{-5}x + 9.413\) |
|
NOx |
\(y = 7.18 \cdot 10^{-7}x + 0.622\) |
|
UC Phase 2 (Running) |
HC |
\(y = 1.15 \cdot 10^{-8}x + 0.029\) |
CO |
\(y = 1.35 \cdot 10^{-5}x + 0.474\) |
|
NOx |
\(y = 1.76 \cdot 10^{-7}x + 0.094\) |
|
UC Phase 3 (Warm Start) |
HC |
\(y = 4.77 \cdot 10^{-8}x + 0.076\) |
CO |
\(y = 0.58 \cdot e^{1.17 \cdot 10^{-5}x}\) |
|
NOx |
\(y = 2.85 \cdot 10^{-7}x + 0.168\) |
Process |
Pollutant |
Regression Equation |
|---|---|---|
UC Phase 1 (Cold Start) |
HC |
\(y = 2.23 \cdot 10^{-6}x + 0.535\) |
CO |
\(y = 3.79 \cdot 10^{-6}x + 8.051\) |
|
NOx |
\(y = 6.54 \cdot 10^{-7}x + 0.158\) |
|
UC Phase 2 (Running) |
HC |
\(y = 4.26 \cdot 10^{-8}x + 0.015\) |
CO |
\(y = 9.02 \cdot 10^{-7}x + 1.133\) |
|
NOx |
\(y = 1.65 \cdot 10^{-7}x + 0.017\) |
|
UC Phase 3 (Warm Start) |
HC |
\(y = 1.95 \cdot 10^{-7}x + 0.034\) |
CO |
\(y = 1.71 \cdot 10^{-6}x + 1.259\) |
|
NOx |
\(y = 3.31 \cdot 10^{-7}x + 0.020\) |
Process |
Pollutant |
Regression Equation |
|---|---|---|
UC Phase 1 (Cold Start) |
HC |
\(y = 5.46 \cdot 10^{-7}x + 0.387\) |
CO |
\(y = 4.64 \cdot 10^{-6}x + 4.434\) |
|
NOx |
\(y = 4.48 \cdot 10^{-7}x + 0.125\) |
|
UC Phase 2 (Running) |
HC |
\(y = 7.77 \cdot 10^{-9}x + 0.011\) |
CO |
\(y = 2.61 \cdot 10^{-6}x + 0.595\) |
|
NOx |
\(y = 3.00 \cdot 10^{-8}x + 0.015\) |
|
UC Phase 3 (Warm Start) |
HC |
\(y = 3.48 \cdot 10^{-8}x + 0.025\) |
CO |
\(y = 2.30 \cdot 10^{-6}x + 0.675\) |
|
NOx |
\(y = 1.85 \cdot 10^{-7}x + 0.020\) |
Process |
Pollutant |
Regression Equation |
|---|---|---|
UC Phase 1 (Cold Start) |
HC |
\(y = 1.68 \cdot 10^{-7}x + 0.107\) |
CO |
\(y = 1.13 \cdot 10^{-5}x + 1.466\) |
|
NOx |
\(y = 1.03 \cdot 10^{-7}x + 0.053\) |
|
UC Phase 2 (Running) |
HC |
\(y = 1.12 \cdot 10^{-8}x + 0.003\) |
CO |
\(y = 2.27 \cdot 10^{-6}x + 0.359\) |
|
NOx |
\(y = 2.00 \cdot 10^{-8}x + 0.005\) |
|
UC Phase 3 (Warm Start) |
HC |
\(y = 3.02 \cdot 10^{-8}x + 0.008\) |
CO |
\(y = 2.16 \cdot 10^{-6}x + 0.266\) |
|
NOx |
\(y = 6.92 \cdot 10^{-9}x + 0.008\) |