4.2. Retention Rate Update#
Retention rates were last updated in EMFAC2017, which used DMV-registered vehicle counts from calendar year 2005 through 2016. In EMFAC2025, the retention rates were updated using DMV data from 2005 through 2022. Although available, data from earlier years of 2000–2004 and 2012–2013 was excluded due to inconsistencies in the DMV records.
Retention rates for each vehicle class were computed using the proportion of vehicles remaining, for a given model year (MY), across each pair of consecutive calendar year (CY), across all the years of DMV data used in the analysis. DMV-registered vehicle counts from calendar year 2005 to 2022 were grouped into calendar year pairs for e.g., 2005–2006, 2006–2007, and so on through 2021–2022, for each vehicle class, either regionally grouped or statewide. Retention rate (\(RR\)) for a given calendar year pair \(CY\), model year, region, vehicle class, and fuel is calculated using Equation (4.1):
where \(P_{CY}\) indicates the DMV-registered vehicle count for calendar year pair \(CY\), model year, region, vehicle class, and fuel type.
These retention rates were then averaged by vehicle age to smooth out year-to-year fluctuations in the data. Retention rate curves were developed by fitting a regression through these age-averaged values. This approach differs from earlier EMFAC models, where retention rates were derived based on survival rates. Details on the previous methodology can be found in Section 3.3.3.1.3 of the EMFAC2014 Technical Documentation (CARB, 2015).
Due to limited DMV data availability by fuel type, vehicle counts were not disaggregated by fuel. As a result, the derived retention rates were applied uniformly across all fuel types. Therefore, diesel and gasoline vehicle counts were combined to derive retention rate curves. In addition, for vehicle classes with adequate data, retention rate curves were computed at the regional level (groups of similar GAIs). The regional grouping is same as the ones used in accrual rates and is illustrated in Figure 4.1. For some vehicle classes, however, only statewide retention rate curves could be developed due to data limitations.
A summary of the geographic levels used in developing retention rates for each vehicle class in EMFAC2025 is provided in Table 4.2 and Table 4.3. Migration into and out of California was unknown but was reasonably assumed to be at a state of equilibrium and could be ignored from the retention rate computational process. Retention rates, organized by vehicle class, Sub-Area, and fuel type, are ultimately assembled by age and used as inputs for vehicle activity calculations in the EMFAC model.
Vehicle Category |
Gasoline Vehicles |
|---|---|
Passenger Cars (LDA) |
Regional (Groups of GAI), Combined Gas and Diesel Counts |
Light-Duty Trucks (LDT1) |
Regional (Groups of GAI), Combined Gas and Diesel Counts |
Light-Duty Trucks (LDT2) |
Regional (Groups of GAI), Combined Gas and Diesel Counts |
Medium-Duty Trucks (MDV) |
Regional (Groups of GAI), Combined Gas and Diesel Counts |
Light-Heavy Duty Trucks (LHD1) |
Regional (Groups of GAI), Combined Gas and Diesel Counts |
Light-Heavy Duty Trucks (LHD2) |
Statewide, Combined Gas and Diesel Counts |
Heavy Duty Trucks 14,001–33,000 lbs. (T6) |
Statewide, Gas Counts Only |
Heavy Duty Trucks >33,000 lbs. (T7) |
Statewide, Gas Counts Only |
Other Buses (OBUS) |
Statewide, Gas Counts Only |
Motorcycles (MCY) |
Regional (Groups of GAI) Gas Counts Only |
School Buses (BS) |
Statewide, Diesel Counts Only |
Motor Homes (MH) |
Statewide, Gas Counts Only |
Vehicle Category |
Diesel & Electric Vehicles |
|---|---|
Passenger Cars (LDA) |
Regional (Groups of GAI), Combined Gas and Diesel Counts |
Light-Duty Trucks (LDT1) |
Regional (Groups of GAI), Combined Gas and Diesel Counts |
Light-Duty Trucks (LDT2) |
Regional (Groups of GAI), Combined Gas and Diesel Counts |
Medium-Duty Trucks (MDV) |
Regional (Groups of GAI), Combined Gas and Diesel Counts |
Light-Heavy Duty Trucks (LHD1) |
See Section 4.6.1 |
Light-Heavy Duty Trucks (LHD2) |
See Section 4.6.1 |
Heavy Duty Trucks 14,001–33,000 lbs. (T6) |
See Section 4.6.1 |
Heavy Duty Trucks >33,000 lbs. (T7) |
See Section 4.6.1 |
Other Buses (OBUS) |
See Section 4.6.1 |
Motorcycles (MCY) |
Not Applicable |
School Buses (BS) |
See Section 4.6.1 |
Motor Homes (MH) |
Not Applicable |
Examples of retention rate curves developed through this analysis are illustrated in Figures 4.5, to 4.7. Figure 4.5 compares EMFAC2021 and EMFAC2025 retention rates for passenger cars (LDA) in Los Angeles County (South Coast Air Basin), with EMFAC2025 values based on the Southern California Coastal Region. Figure 4.6 presents the same comparison for passenger cars (LDA) in Kern County (San Joaquin Valley Air Basin), using EMFAC2025 rates from the Central Valley South Region. Figure 4.7 compares statewide retention rates for the Light Heavy-Duty Trucks (LHD2) category between EMFAC2021 and EMFAC2025.
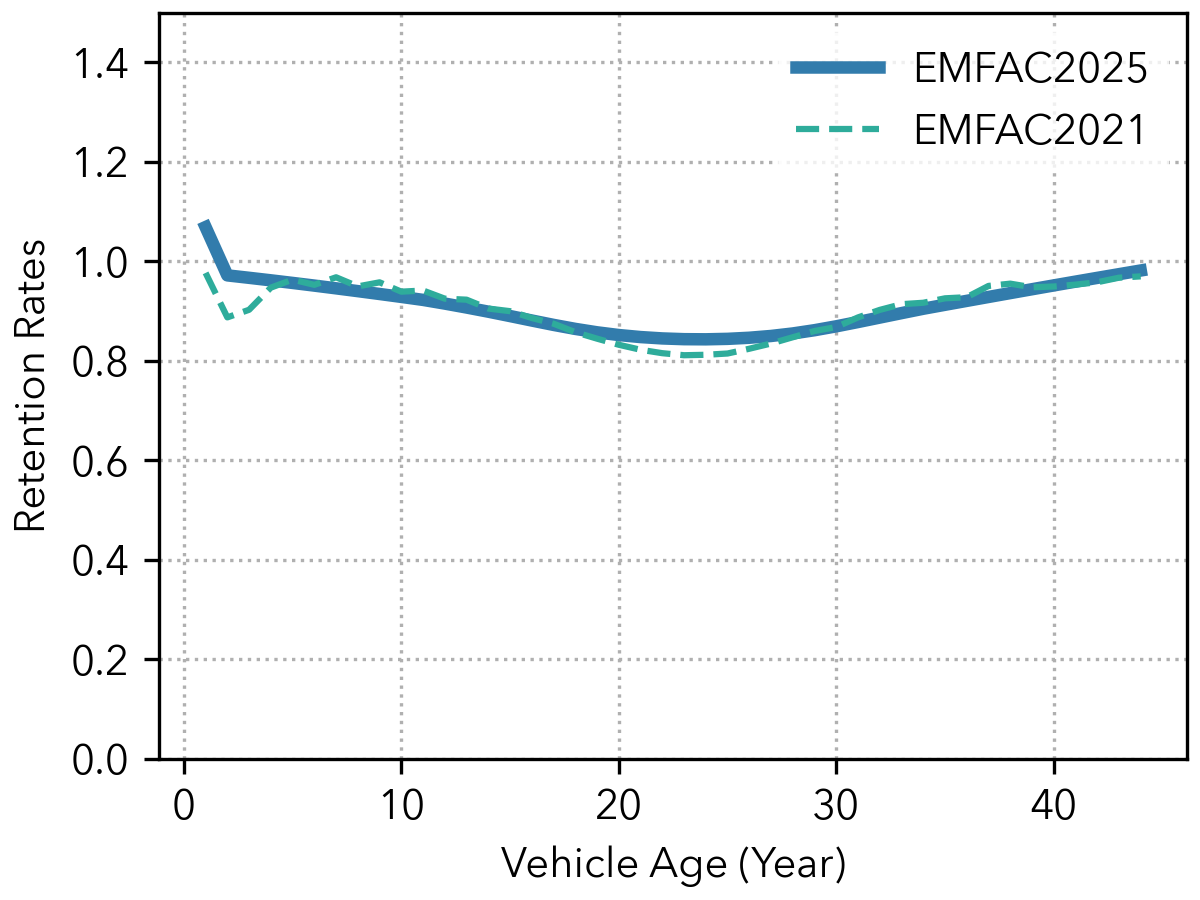
Figure 4.5: Retention Rates for Passenger Car (LDA) for Los Angeles County in the South Coast Air Basin#
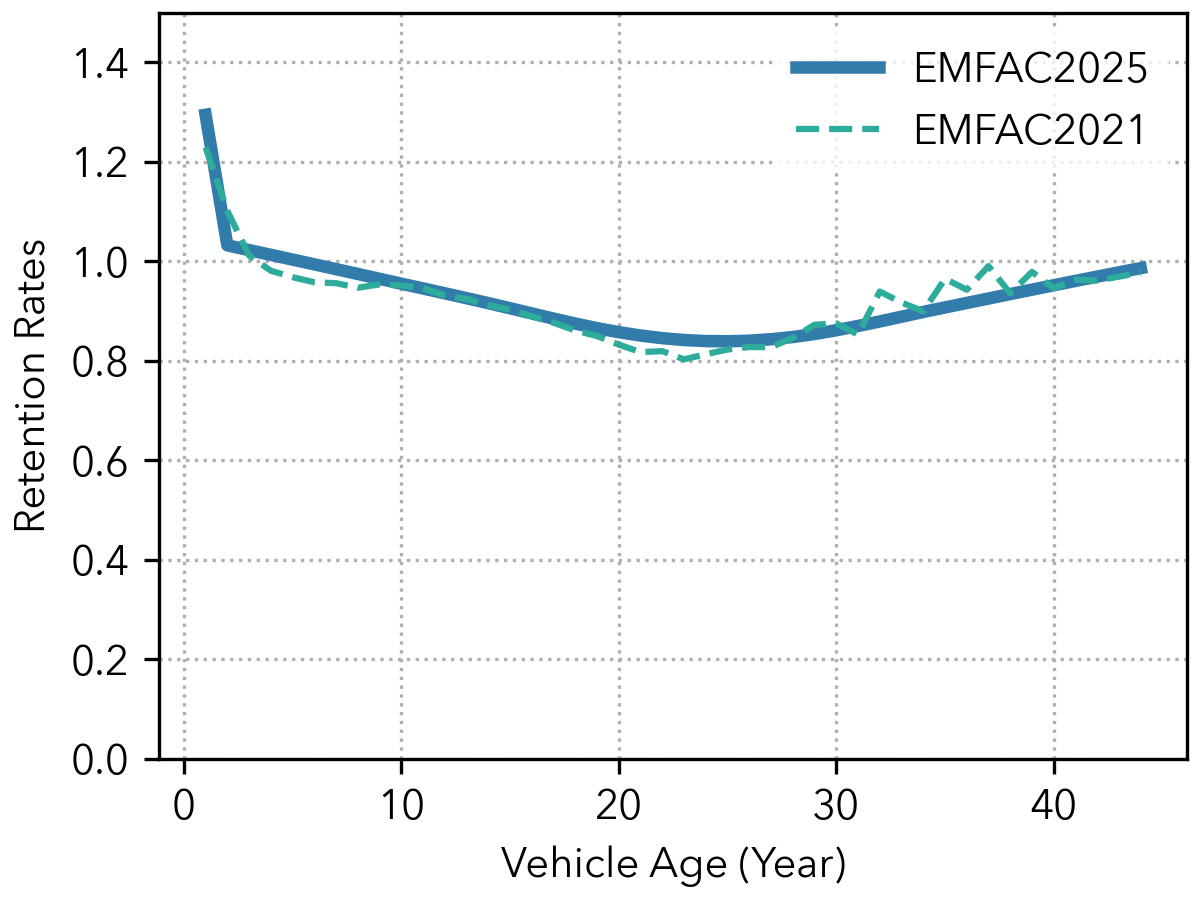
Figure 4.6: Retention Rates for Passenger Car (LDA) for Kern County in the San Joaquin Valley Air Basin#
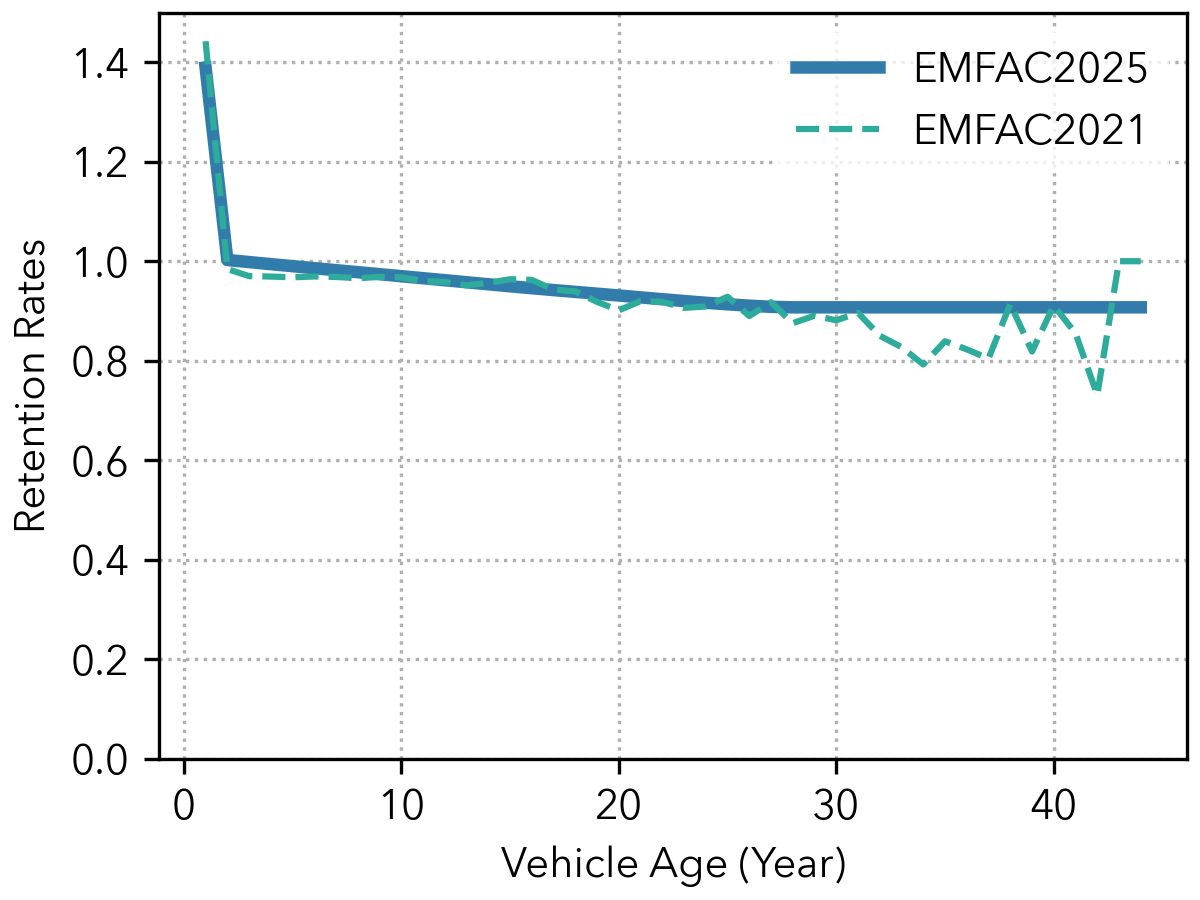
Figure 4.7: Statewide Retention Rates Curves for Light Heavy-Duty Trucks (LHD2)#