6.3. Light-Duty Speed Correction Factor Update#
6.3.1. Background#
The HC, CO, CO2 and NOx Speed Correction Factors (SCF) used for light-duty vehicles were developed for EMFAC2000 and used in each version of the model through EMFAC2021. These SCFs were based on a set of 12 dynamometer driving cycles referred to as the Unified Correction Cycles (UCC). These 12 cycles were designed to be representative of an average trip at a given speed, where the mean speeds ranged from approximately 2.4 mph to 59.1 mph at 5 mph increments. The vehicles used in that analysis were selected from light-duty surveillance projects 2S95C1 and 2S97C1, conducted in 1995 and 1997 respectively, and from the research projects 2R9513 and 2R9811, which were conducted in 1995 and 1998.
The CO2 SCFs for multiport fuel injection (MPFI) light-duty through medium-duty vehicles were updated in EMFAC2017 and are carried forward to EMFAC2025. The CO2 SCFs were applied to all gasoline MPFI technology groups and for the vehicle classes of light-duty passenger vehicles through medium-duty trucks (PC, T1, T2, and T3).
To update light-duty SCFs for HC, CO and NOx in EMFAC2025, dynamometer test data collected from vehicles driven on arterial and freeway driving cycles were analyzed. These driving cycles were developed to represent real-world driving along with the Unified Cycle (UC). The arterial cycles represent surface street and arterial driving for speeds averaging between 7 and 55 mph, while the freeway cycles represent average driving conditions between 15 and 73 mph. The UCC, arterial, and freeway cycles are shown in Table 6.11.
The four arterial cycles and seven freeway cycles were implemented in light-duty Vehicle Surveillance Program Series 19 in 2012 (Project 2S11C1) and provided test data from 94 vehicles. The recent light-duty Vehicle Surveillance Program Series 21 (Project 2S22C1) is currently ongoing and has provided data from 3 test vehicles for this update.
The distribution of test vehicles by their respective technology group is shown in Table 6.12.
6.3.2. Analysis of LDVSP19 and LDVSP21 Test Data#
The test vehicles were categorized into three groups: Pre-LEV, LEV I, and LEV II/LEV III. The number of test vehicles in each group is as follows:
Pre-LEV: 17 vehicles
LEV I: 42 vehicles
LEV II/LEV III: 38 vehicles
Driving Cycle |
Average Speed (mph) |
|---|---|
Unified Correction Cycle (UCC) 5 |
2.5 |
UCC 10 |
7.5 |
UCC 15 |
12.5 |
UCC 20 |
17.5 |
UCC 25 |
22.5 |
UCC 30 |
27.5 |
UCC 35 |
32.5 |
UCC 40 |
37.5 |
UCC 45 |
42.5 |
Arterial Cycle (AC) 1 |
7 |
AC 2 |
23 |
AC 3 |
39 |
AC 4 |
55 |
Freeway Cycle (FC) 1 |
15 |
FC 2 |
25 |
FC 3 |
33 |
FC 4 |
46 |
FC 5 |
57 |
FC 6 |
65 |
FC 7 |
73 |
Project |
Tech Group |
Number of Test Vehicles |
|---|---|---|
2S11C1 |
Pre-LEV |
17 |
LEV I LEV |
23 |
|
LEV I ULEV |
19 |
|
LEV II LEV |
6 |
|
LEV II ULEV |
20 |
|
LEV II SULEV |
8 |
|
SULEV |
1 |
|
2S22C01 |
LEV II SULEV |
2 |
LEV III SULEV30 |
1 |
We considered dividing the vehicles into four groups (Pre-LEV, LEV I, ULEV, and SULEV) to potentially derive more accurate SCFs. The LEV II and LEV III groups are required to be certified to the SFTP cycle, which is expected to result in lower SCFs at high speeds compared to vehicles not required to certify to the SFTP cycle. However, the sample size for some groups would be too small (e.g., only one LEV III SULEV30 vehicle). Therefore, we grouped the vehicles into three categories to ensure a larger sample size per group.
SCFs were developed for each of the three vehicle groups and for each pollutant of HC, NOx, and CO. First, emission rates were averaged by speed bin for each driving cycle. Next, a best-fit equation was derived using average emission rate and average speed. Then, emission rates calculated using the derived equation were normalized to the speed of 27.4 mph by speed bin to develop SCFs.
Note that SCFs for speed bins of 75 mph and above are assumed to be the same as those of the 70-mph speed bin for pre-LEV and LEV I. For LEV II/LEV III, SCFs for speed bins of 70 mph and above were separately developed in the High-Speed Driving project, which is described in Section 2.2.3.
6.3.3. HC Speed Correction Factor#
Figure 6.25 shows HC emission rates by average speed, which were calculated from the test data.
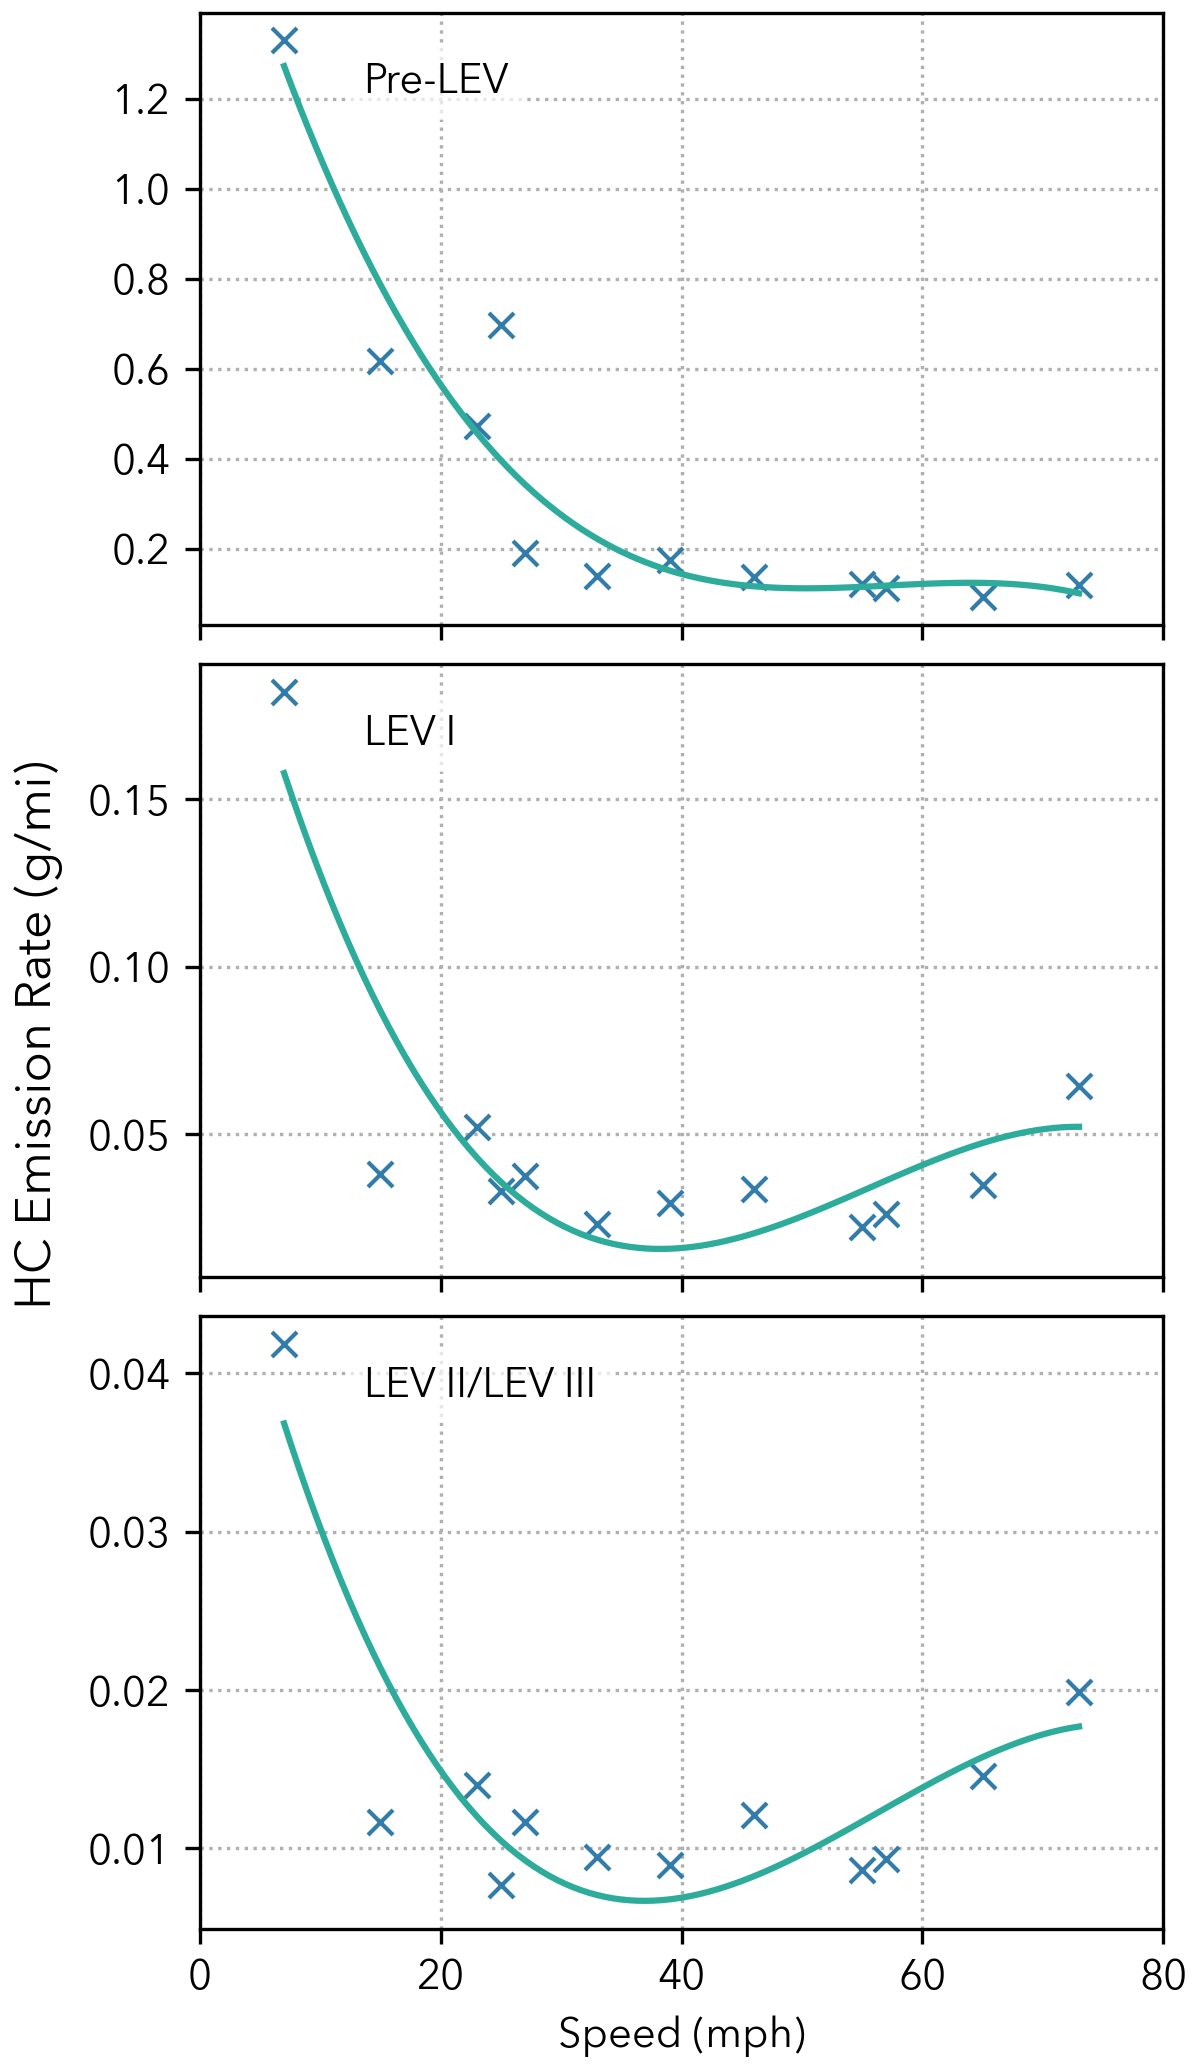
Figure 6.25: Average HC Emissions by Vehicle Speed#
For each technology group, a best-fit equation was derived from the averaged data:
where \(y\) is the HC emission rate (g/mi) and \(x\) is vehicle speed (mph).
Emission rates calculated using these equations are shown in Tables 6.13 to 6.15 by speed bin. All emission rates were normalized to 27.4 mph to produce speed correction factors (SCF), as shown in Tables 6.13 to 6.15. This table also compares EMFAC2025 SCFs with those from EMFAC2021. Note SCF of each speed bin derived for its mid-point speed (e.g., SCF of 25 mph Speed Bin is derived for 22.5 mph).
Figure 6.26 presents the SCF results, with HC SCFs from EMFAC2021 also shown for comparison.
Speed Bin |
Mid-Point Speed (mph) |
EMFAC2025 HC (g/mi) |
EMFAC2025 HC SCF |
EMFAC2021 HC SCF |
|---|---|---|---|---|
5 |
2.5 |
1.411 |
4.248 |
5.913 |
10 |
7.5 |
1.063 |
3.199 |
3.720 |
15 |
12.5 |
0.782 |
2.353 |
2.469 |
20 |
17.5 |
0.562 |
1.691 |
1.729 |
25 |
22.5 |
0.395 |
1.190 |
1.277 |
30 |
27.5 |
0.275 |
0.828 |
0.996 |
35 |
32.5 |
0.194 |
0.584 |
0.819 |
40 |
37.5 |
0.145 |
0.435 |
0.710 |
45 |
42.5 |
0.120 |
0.361 |
0.650 |
50 |
47.5 |
0.113 |
0.339 |
0.627 |
55 |
52.5 |
0.115 |
0.348 |
0.639 |
60 |
57.5 |
0.121 |
0.365 |
0.686 |
65 |
62.5 |
0.123 |
0.370 |
0.778 |
70 |
67.5 |
0.113 |
0.340 |
0.845 |
75\(^*\) |
72.5 |
0.113 |
0.340 |
0.845 |
80\(^*\) |
77.5 |
0.113 |
0.340 |
0.845 |
85\(^*\) |
82.5 |
0.113 |
0.340 |
0.845 |
90\(^*\) |
87.5 |
0.113 |
0.340 |
0.845 |
\(^*\) The 70-mph speed bin values are used.
Speed Bin |
Mid-Point Speed (mph) |
EMFAC2025 HC (g/mi) |
EMFAC2025 HC SCF |
EMFAC2021 HC SCF |
|---|---|---|---|---|
5 |
2.5 |
0.180 |
6.335 |
5.913 |
10 |
7.5 |
0.127 |
4.477 |
3.720 |
15 |
12.5 |
0.086 |
3.041 |
2.469 |
20 |
17.5 |
0.056 |
1.980 |
1.729 |
25 |
22.5 |
0.035 |
1.248 |
1.277 |
30 |
27.5 |
0.023 |
0.799 |
0.996 |
35 |
32.5 |
0.017 |
0.585 |
0.819 |
40 |
37.5 |
0.016 |
0.562 |
0.710 |
45 |
42.5 |
0.019 |
0.681 |
0.650 |
50 |
47.5 |
0.025 |
0.897 |
0.627 |
55 |
52.5 |
0.033 |
1.163 |
0.639 |
60 |
57.5 |
0.041 |
1.432 |
0.686 |
65 |
62.5 |
0.047 |
1.659 |
0.778 |
70 |
67.5 |
0.051 |
1.796 |
0.845 |
75\(^*\) |
72.5 |
0.051 |
1.796 |
0.845 |
80\(^*\) |
77.5 |
0.051 |
1.796 |
0.845 |
85\(^*\) |
82.5 |
0.051 |
1.796 |
0.845 |
90\(^*\) |
87.5 |
0.051 |
1.796 |
0.845 |
\(^*\) The 70-mph speed bin values are used.
Speed Bin\(^*\) |
Mid-Point Speed (mph) |
EMFAC2025 HC (g/mi) |
EMFAC2025 HC SCF |
EMFAC2021 HC SCF |
|---|---|---|---|---|
5 |
2.5 |
0.042 |
4.630 |
5.913 |
10 |
7.5 |
0.030 |
3.352 |
3.720 |
15 |
12.5 |
0.021 |
2.370 |
2.469 |
20 |
17.5 |
0.015 |
1.650 |
1.729 |
25 |
22.5 |
0.010 |
1.162 |
1.277 |
30 |
27.5 |
0.008 |
0.873 |
0.996 |
35 |
32.5 |
0.007 |
0.751 |
0.819 |
40 |
37.5 |
0.007 |
0.765 |
0.710 |
45 |
42.5 |
0.008 |
0.882 |
0.650 |
50 |
47.5 |
0.010 |
1.071 |
0.627 |
55 |
52.5 |
0.012 |
1.300 |
0.639 |
60 |
57.5 |
0.014 |
1.537 |
0.686 |
65 |
62.5 |
0.016 |
1.750 |
0.778 |
\(^*\) See Section 2.2.3.2.1 for speed correction factors of 70 to 90 mph speed bins.
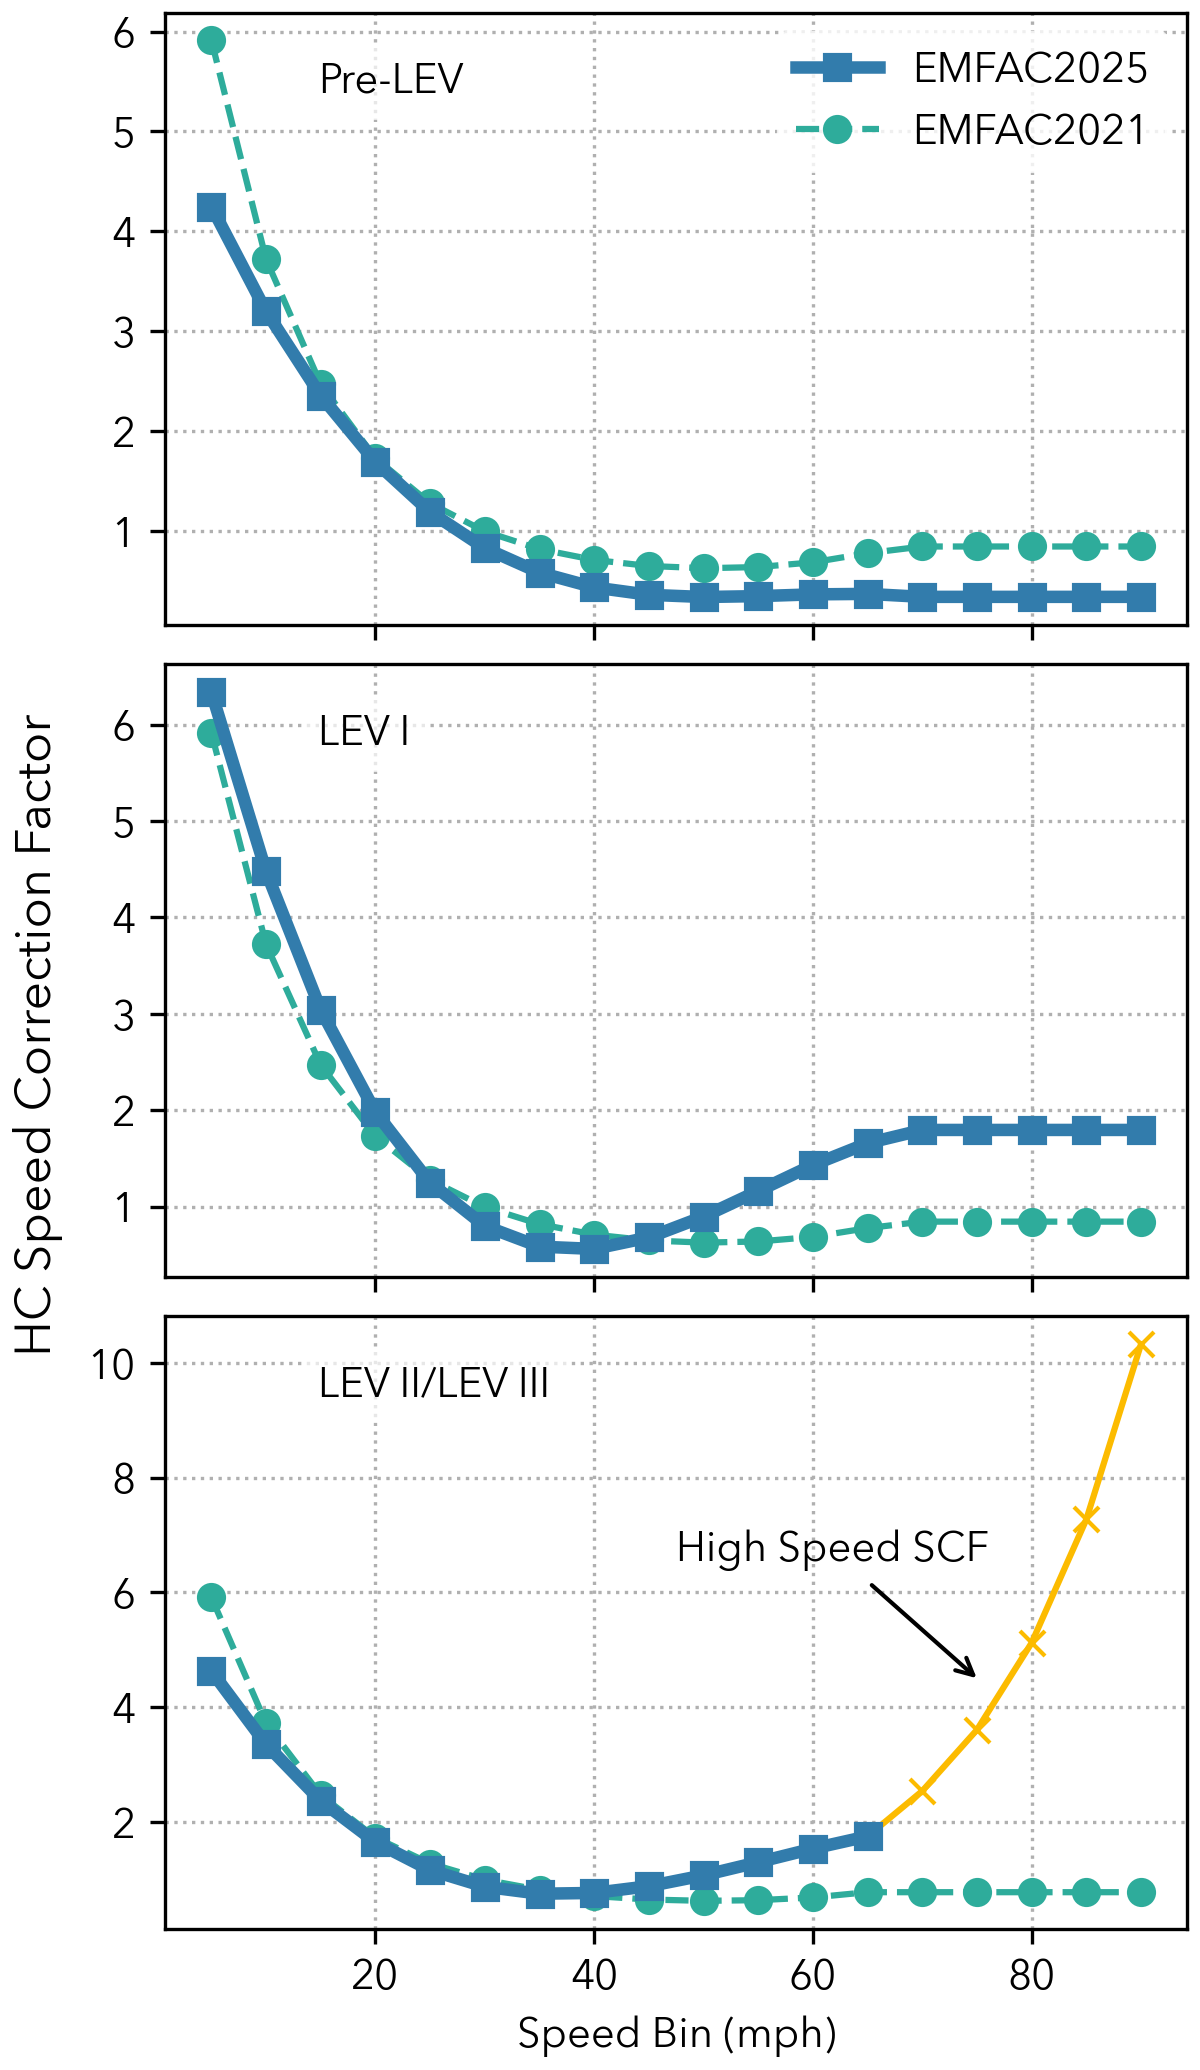
Figure 6.26: HC Speed Correction Factor: EMFAC2025 vs. EMFAC2021#
6.3.4. NOx Speed Correction Factor#
Figure 6.27 shows NOx emission rates by average speed, which were calculated from the test data.
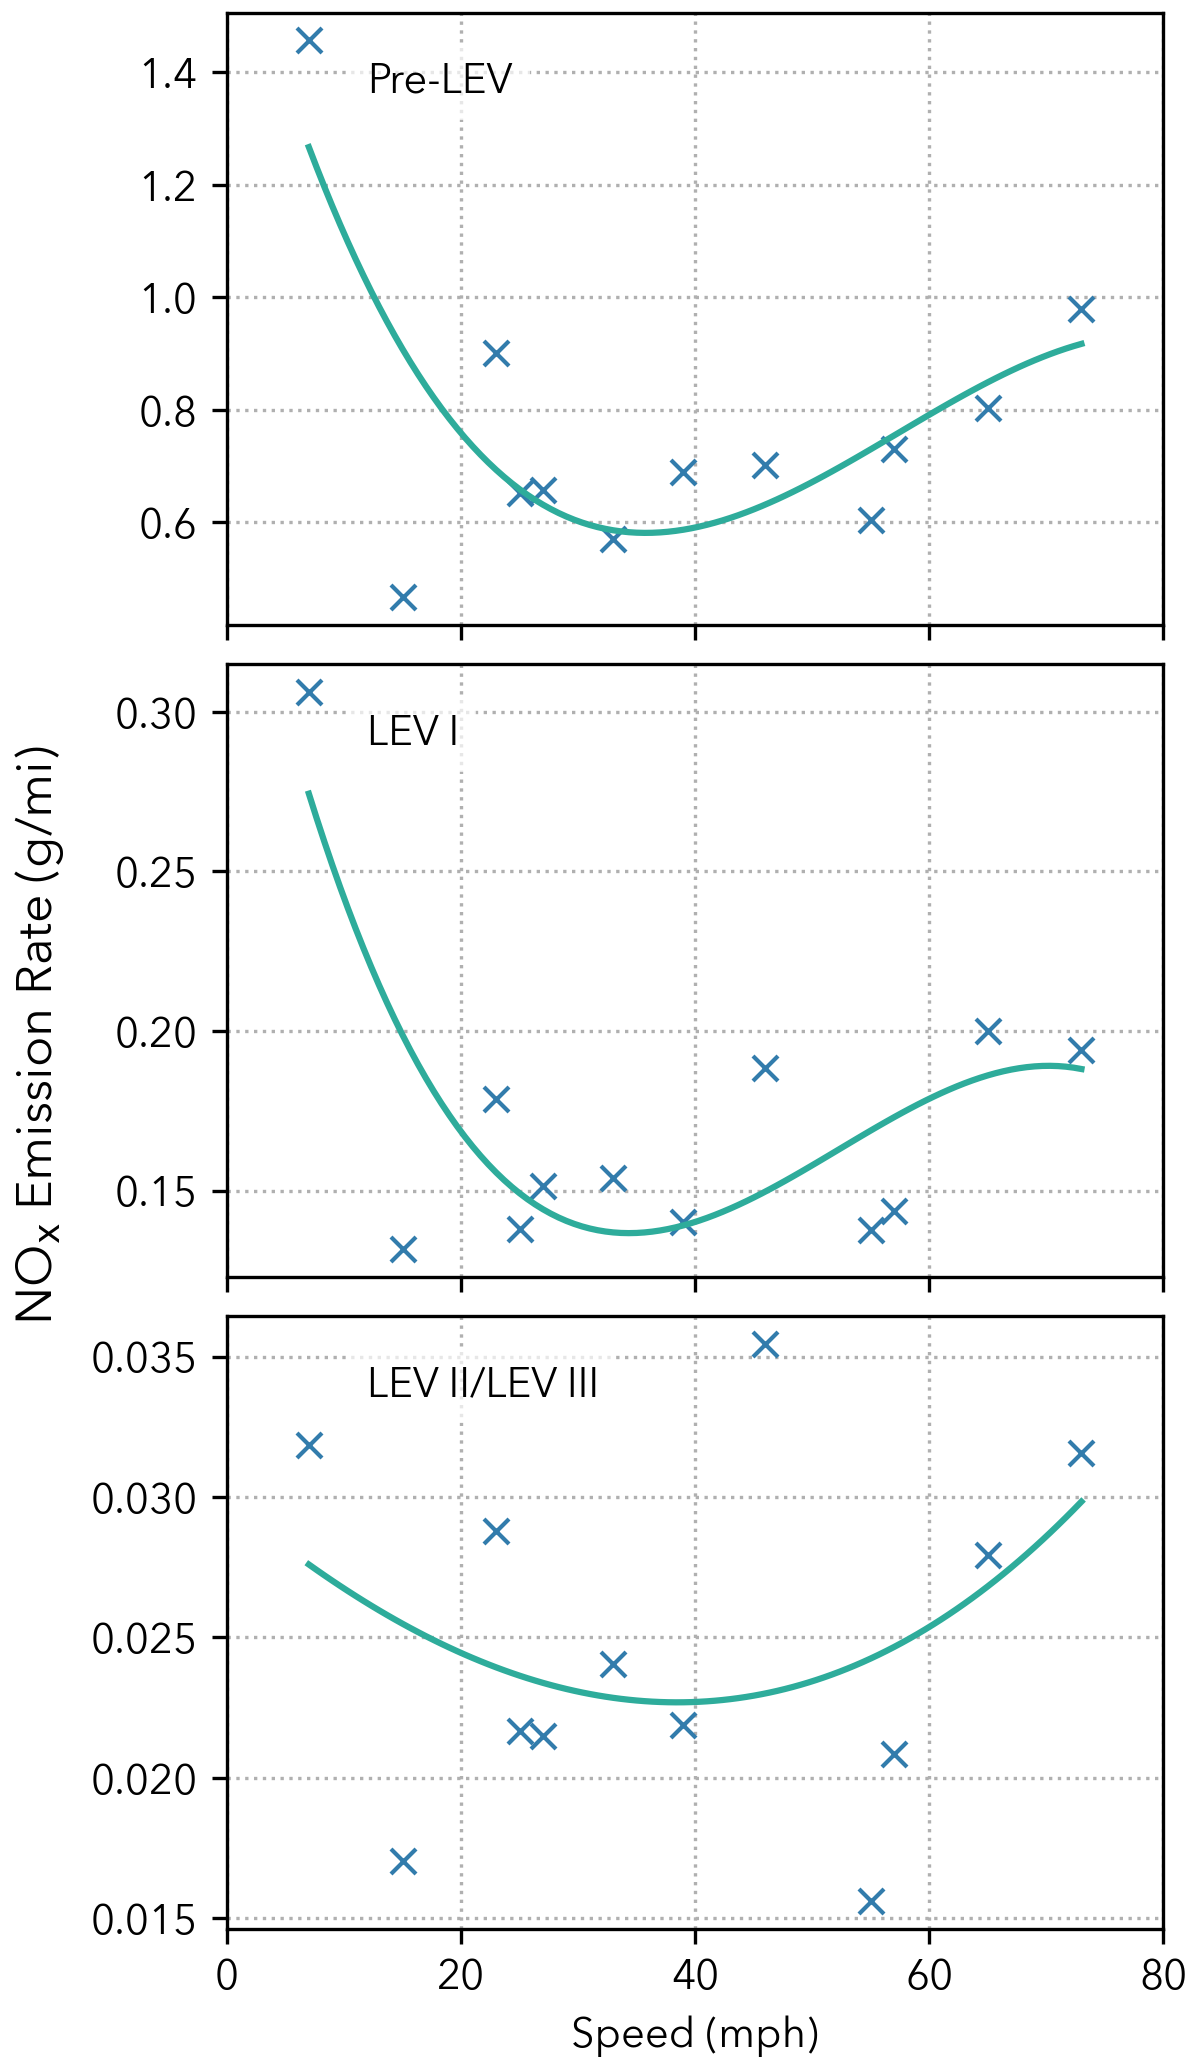
Figure 6.27: Average NOx Emissions by Vehicle Speed#
For each technology group, a best-fit equation was derived from the averaged data:
where \(y\) is the NOx emission rate (g/mi) and \(x\) is vehicle speed (mph).
Emission rates calculated using these equations are shown in Tables 6.16 to 6.18 by speed bin. All emission rates were normalized to 27.4 mph to produce speed correction factors (SCF), as shown in Tables 6.16 to 6.18. This table also compares EMFAC2025 SCFs with those from EMFAC2021.
Figure 6.28 presents the SCF results, with NOx SCFs from EMFAC2021 also shown for comparison.
Speed Bin\(^*\) |
Mid-Point Speed (mph) |
EMFAC2025 NOx (g/mi) |
EMFAC2025 NOx SCF |
EMFAC2021 NOx SCF |
|---|---|---|---|---|
5 |
2.5 |
1.385 |
2.219 |
1.718 |
10 |
7.5 |
1.114 |
1.785 |
1.493 |
15 |
12.5 |
0.907 |
1.453 |
1.318 |
20 |
17.5 |
0.757 |
1.212 |
1.182 |
25 |
22.5 |
0.657 |
1.052 |
1.078 |
30 |
27.5 |
0.600 |
0.961 |
0.999 |
35 |
32.5 |
0.580 |
0.928 |
0.940 |
40 |
37.5 |
0.589 |
0.944 |
0.899 |
45 |
42.5 |
0.622 |
0.996 |
0.874 |
50 |
47.5 |
0.671 |
1.075 |
0.863 |
55 |
52.5 |
0.730 |
1.169 |
0.866 |
60 |
57.5 |
0.791 |
1.267 |
0.883 |
65 |
62.5 |
0.849 |
1.359 |
0.915 |
70 |
67.5 |
0.895 |
1.434 |
0.937 |
75\(^*\) |
72.5 |
0.895 |
1.434 |
0.937 |
80\(^*\) |
77.5 |
0.895 |
1.434 |
0.937 |
85\(^*\) |
82.5 |
0.895 |
1.434 |
0.937 |
90\(^*\) |
87.5 |
0.895 |
1.434 |
0.937 |
\(^*\) The 70-mph speed bin values are used.
Speed Bin\(^*\) |
Mid-Point Speed (mph) |
EMFAC2025 NOx (g/mi) |
EMFAC2025 NOx SCF |
EMFAC2021 NOx SCF |
|---|---|---|---|---|
5 |
2.5 |
0.299 |
2.091 |
1.718 |
10 |
7.5 |
0.242 |
1.689 |
1.493 |
15 |
12.5 |
0.199 |
1.388 |
1.318 |
20 |
17.5 |
0.168 |
1.176 |
1.182 |
25 |
22.5 |
0.149 |
1.041 |
1.078 |
30 |
27.5 |
0.139 |
0.971 |
0.999 |
35 |
32.5 |
0.137 |
0.955 |
0.940 |
40 |
37.5 |
0.140 |
0.979 |
0.899 |
45 |
42.5 |
0.148 |
1.033 |
0.874 |
50 |
47.5 |
0.158 |
1.104 |
0.863 |
55 |
52.5 |
0.169 |
1.181 |
0.866 |
60 |
57.5 |
0.179 |
1.251 |
0.883 |
65 |
62.5 |
0.186 |
1.302 |
0.915 |
70 |
67.5 |
0.189 |
1.323 |
0.937 |
75\(^*\) |
72.5 |
0.189 |
1.323 |
0.937 |
80\(^*\) |
77.5 |
0.189 |
1.323 |
0.937 |
85\(^*\) |
82.5 |
0.189 |
1.323 |
0.937 |
90\(^*\) |
87.5 |
0.189 |
1.323 |
0.937 |
\(^*\) The 70-mph speed bin values are used.
Speed Bin\(^*\) |
Mid-Point Speed (mph) |
EMFAC2025 NOx (g/mi) |
EMFAC2025 NOx SCF |
EMFAC2021 NOx SCF |
|---|---|---|---|---|
5 |
2.5 |
0.028 |
1.222 |
1.718 |
10 |
7.5 |
0.027 |
1.154 |
1.493 |
15 |
12.5 |
0.026 |
1.097 |
1.318 |
20 |
17.5 |
0.024 |
1.050 |
1.182 |
25 |
22.5 |
0.024 |
1.013 |
1.078 |
30 |
27.5 |
0.023 |
0.988 |
0.999 |
35 |
32.5 |
0.023 |
0.975 |
0.940 |
40 |
37.5 |
0.023 |
0.973 |
0.899 |
45 |
42.5 |
0.023 |
0.984 |
0.874 |
50 |
47.5 |
0.023 |
1.007 |
0.863 |
55 |
52.5 |
0.024 |
1.043 |
0.866 |
60 |
57.5 |
0.025 |
1.091 |
0.883 |
65 |
62.5 |
0.027 |
1.154 |
0.915 |
\(^*\) See Section 2.2.3.2.2 for speed correction factors of 70 to 90 mph speed bins.
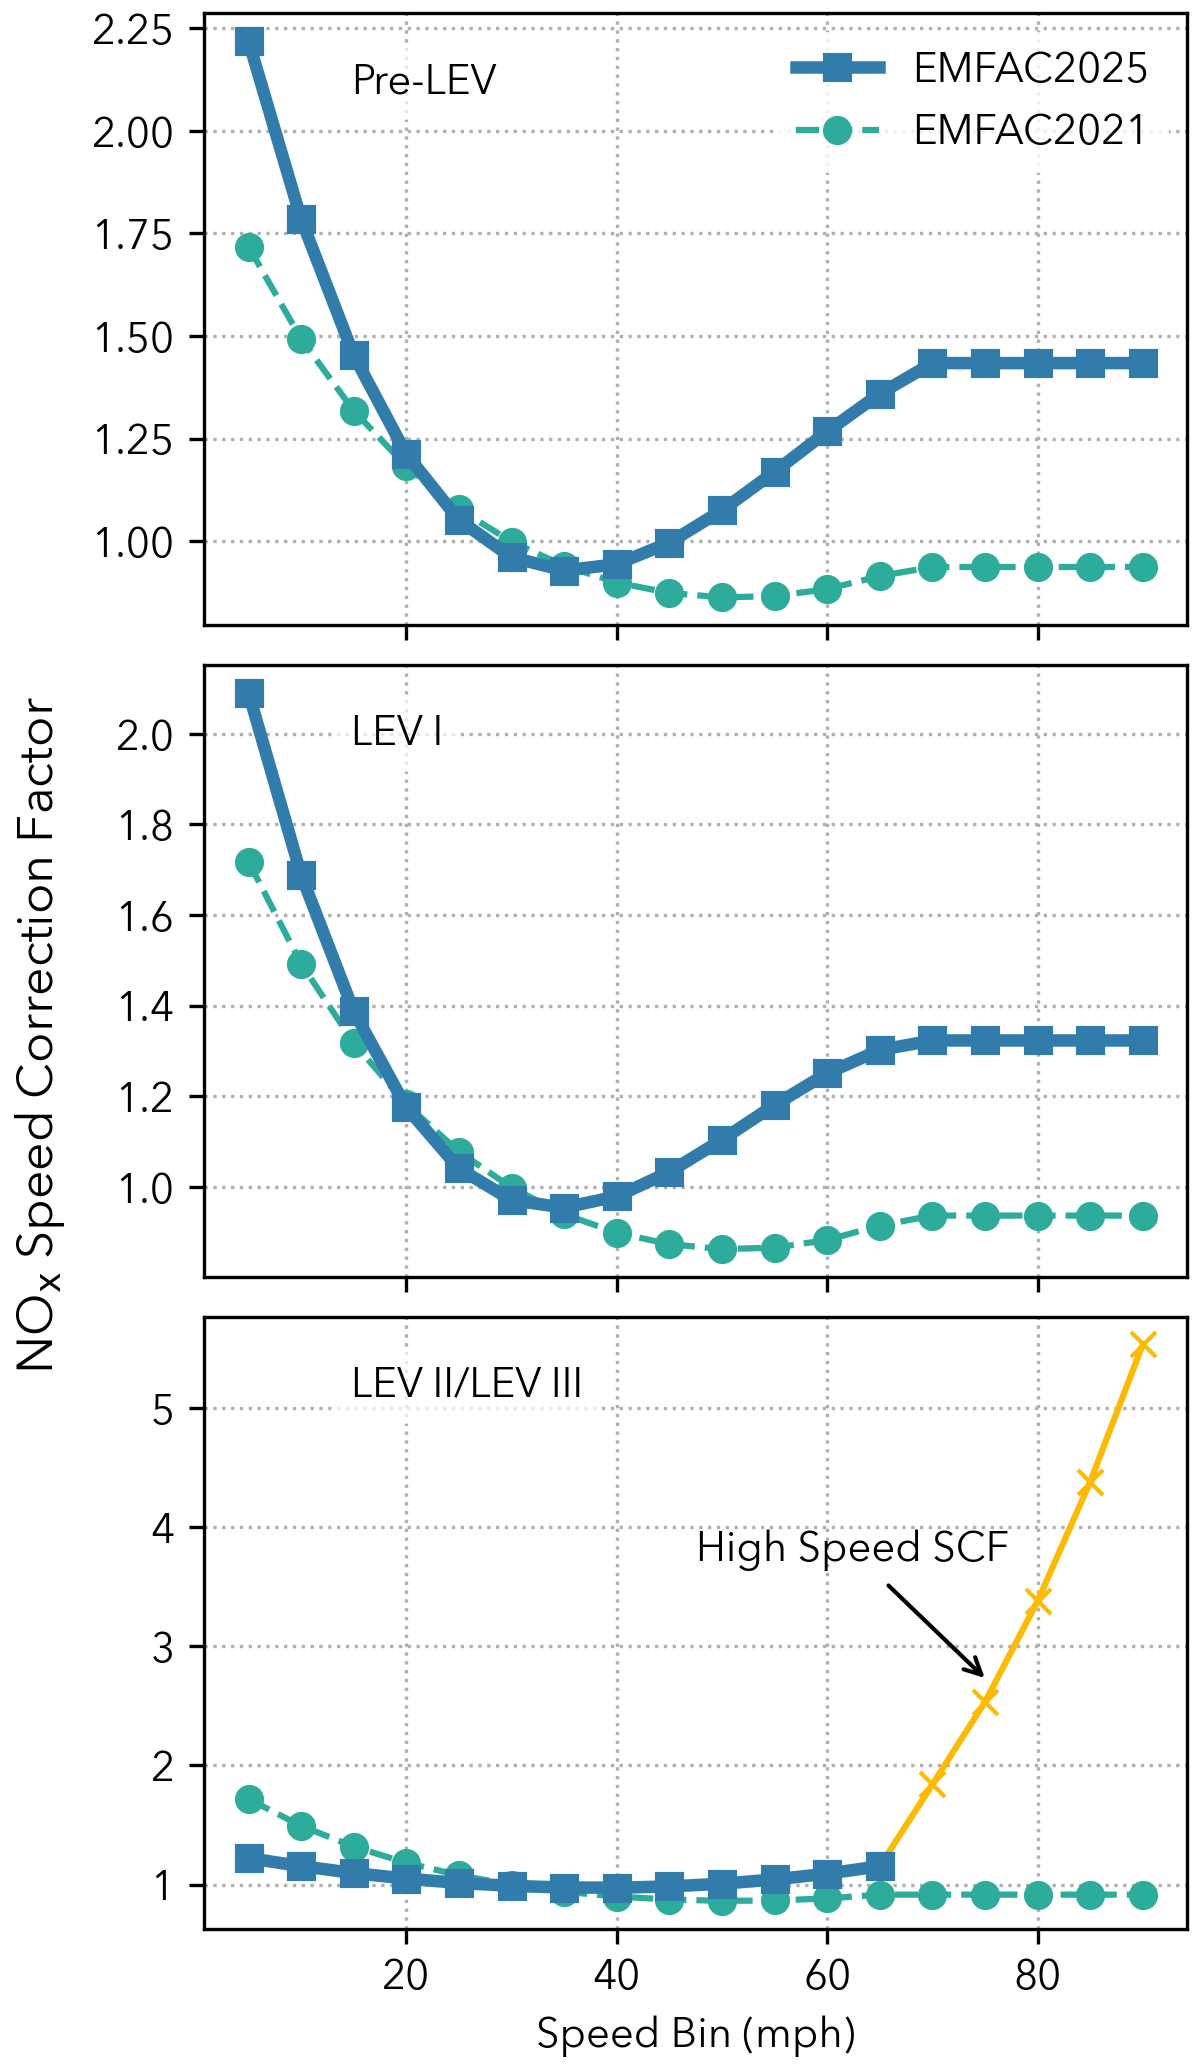
Figure 6.28: NOx Speed Correction Factor: EMFAC2025 vs. EMFAC2021#
6.3.5. CO Speed Correction Factor#
Figure 6.29 shows CO emission rates by average speed, which were calculated from the test data.
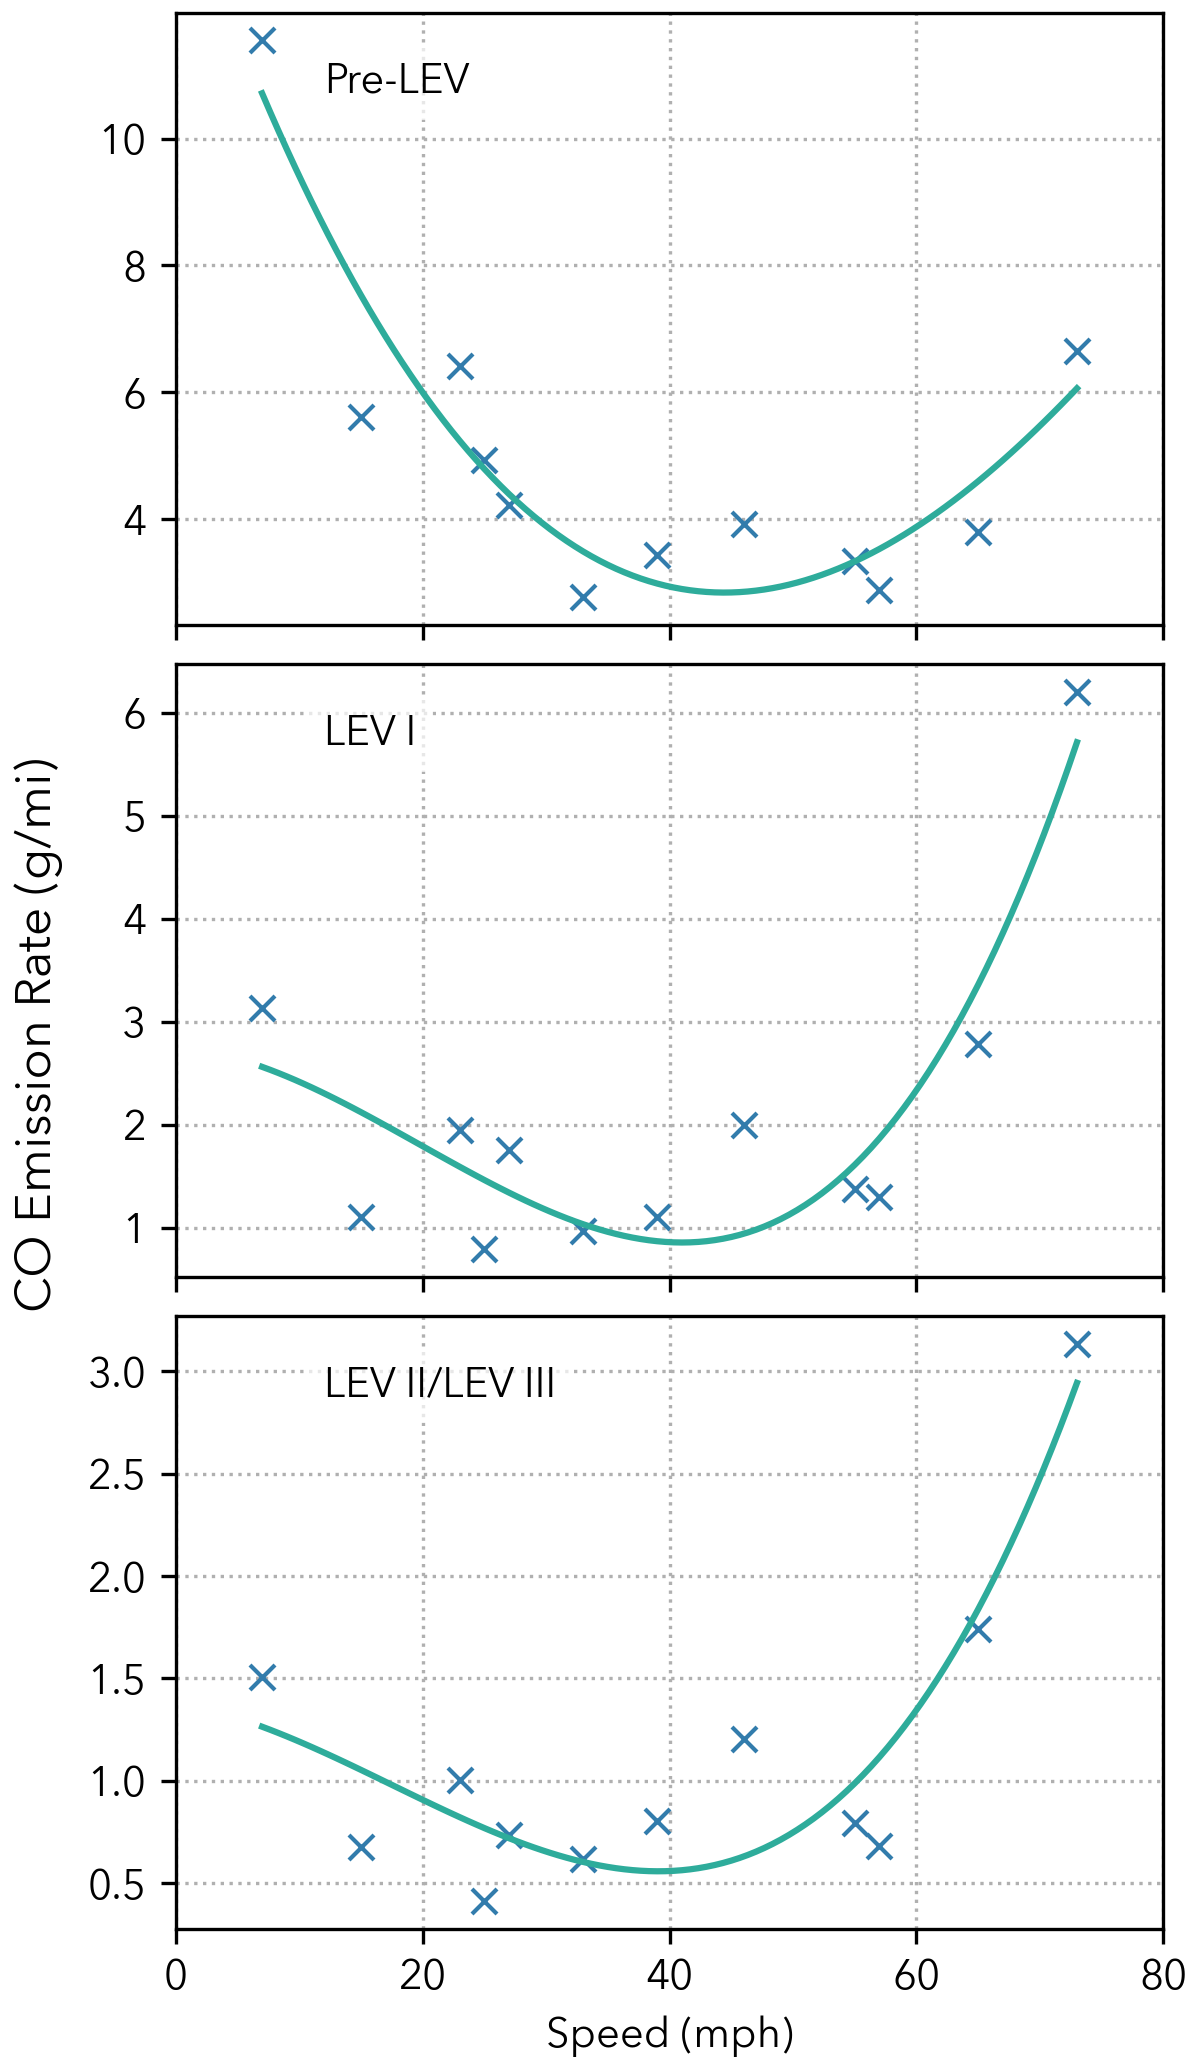
Figure 6.29: Average CO Emissions by Vehicle Speed#
For each technology group, a best-fit equation was derived from the averaged data:
where \(y\) is the CO emission rate (g/mi) and \(x\) is vehicle speed (mph).
Emission rates calculated using these equations are shown in Tables 6.19 to 6.21 by speed bin. All emission rates were normalized to 27.4 mph to produce speed correction factors (SCF), as shown in Tables 6.19 to 6.21. This table also compares EMFAC2025 SCFs with those from EMFAC2021.
Figure 6.30 presents the SCF results, with CO SCFs from EMFAC2021 also shown for comparison.
Speed Bin\(^*\) |
Mid-Point Speed (mph) |
EMFAC2025 CO (g/mi) |
EMFAC2025 CO SCF |
EMFAC2021 CO SCF |
|---|---|---|---|---|
5 |
2.5 |
11.644 |
2.745 |
1.551 |
10 |
7.5 |
9.398 |
2.215 |
1.413 |
15 |
12.5 |
7.512 |
1.771 |
1.290 |
20 |
17.5 |
5.963 |
1.406 |
1.181 |
25 |
22.5 |
4.729 |
1.115 |
1.084 |
30 |
27.5 |
3.788 |
0.893 |
0.998 |
35 |
32.5 |
3.117 |
0.735 |
0.922 |
40 |
37.5 |
2.693 |
0.635 |
0.853 |
45 |
42.5 |
2.494 |
0.588 |
0.792 |
50 |
47.5 |
2.498 |
0.589 |
0.737 |
55 |
52.5 |
2.682 |
0.632 |
0.687 |
60 |
57.5 |
3.023 |
0.713 |
0.643 |
65 |
62.5 |
3.499 |
0.825 |
0.603 |
70 |
67.5 |
4.088 |
0.964 |
0.585 |
75\(^*\) |
72.5 |
4.088 |
0.964 |
0.585 |
80\(^*\) |
77.5 |
4.088 |
0.964 |
0.585 |
85\(^*\) |
82.5 |
4.088 |
0.964 |
0.585 |
90\(^*\) |
87.5 |
4.088 |
0.964 |
0.585 |
\(^*\) The 70-mph speed bin values are used.
Speed Bin\(^*\) |
Mid-Point Speed (mph) |
EMFAC2025 CO (g/mi) |
EMFAC2025 CO SCF |
EMFAC2021 CO SCF |
|---|---|---|---|---|
5 |
2.5 |
2.673 |
2.044 |
1.551 |
10 |
7.5 |
2.433 |
1.860 |
1.413 |
15 |
12.5 |
2.125 |
1.625 |
1.290 |
20 |
17.5 |
1.787 |
1.366 |
1.181 |
25 |
22.5 |
1.455 |
1.112 |
1.084 |
30 |
27.5 |
1.165 |
0.890 |
0.998 |
35 |
32.5 |
0.953 |
0.729 |
0.922 |
40 |
37.5 |
0.857 |
0.655 |
0.853 |
45 |
42.5 |
0.912 |
0.697 |
0.792 |
50 |
47.5 |
1.155 |
0.883 |
0.737 |
55 |
52.5 |
1.622 |
1.240 |
0.687 |
60 |
57.5 |
2.349 |
1.796 |
0.643 |
65 |
62.5 |
3.374 |
2.580 |
0.603 |
70 |
67.5 |
4.732 |
3.618 |
0.585 |
75\(^*\) |
72.5 |
4.732 |
3.618 |
0.585 |
80\(^*\) |
77.5 |
4.732 |
3.618 |
0.585 |
85\(^*\) |
82.5 |
4.732 |
3.618 |
0.585 |
90\(^*\) |
87.5 |
4.732 |
3.618 |
0.585 |
\(^*\) The 70-mph speed bin values are used.
Speed Bin\(^*\) |
Mid-Point Speed (mph) |
EMFAC2025 CO (g/mi) |
EMFAC2025 CO SCF |
EMFAC2021 CO SCF |
|---|---|---|---|---|
5 |
2.5 |
1.320 |
1.872 |
1.551 |
10 |
7.5 |
1.198 |
1.699 |
1.413 |
15 |
12.5 |
1.054 |
1.495 |
1.290 |
20 |
17.5 |
0.904 |
1.283 |
1.181 |
25 |
22.5 |
0.764 |
1.084 |
1.084 |
30 |
27.5 |
0.649 |
0.921 |
0.998 |
35 |
32.5 |
0.575 |
0.815 |
0.922 |
40 |
37.5 |
0.556 |
0.789 |
0.853 |
45 |
42.5 |
0.609 |
0.864 |
0.792 |
50 |
47.5 |
0.748 |
1.061 |
0.737 |
55 |
52.5 |
0.990 |
1.404 |
0.687 |
60 |
57.5 |
1.349 |
1.914 |
0.643 |
65 |
62.5 |
1.842 |
2.612 |
0.603 |
\(^*\) See Section 2.2.3.2.3 for speed correction factors of 70 to 90 mph speed bins.
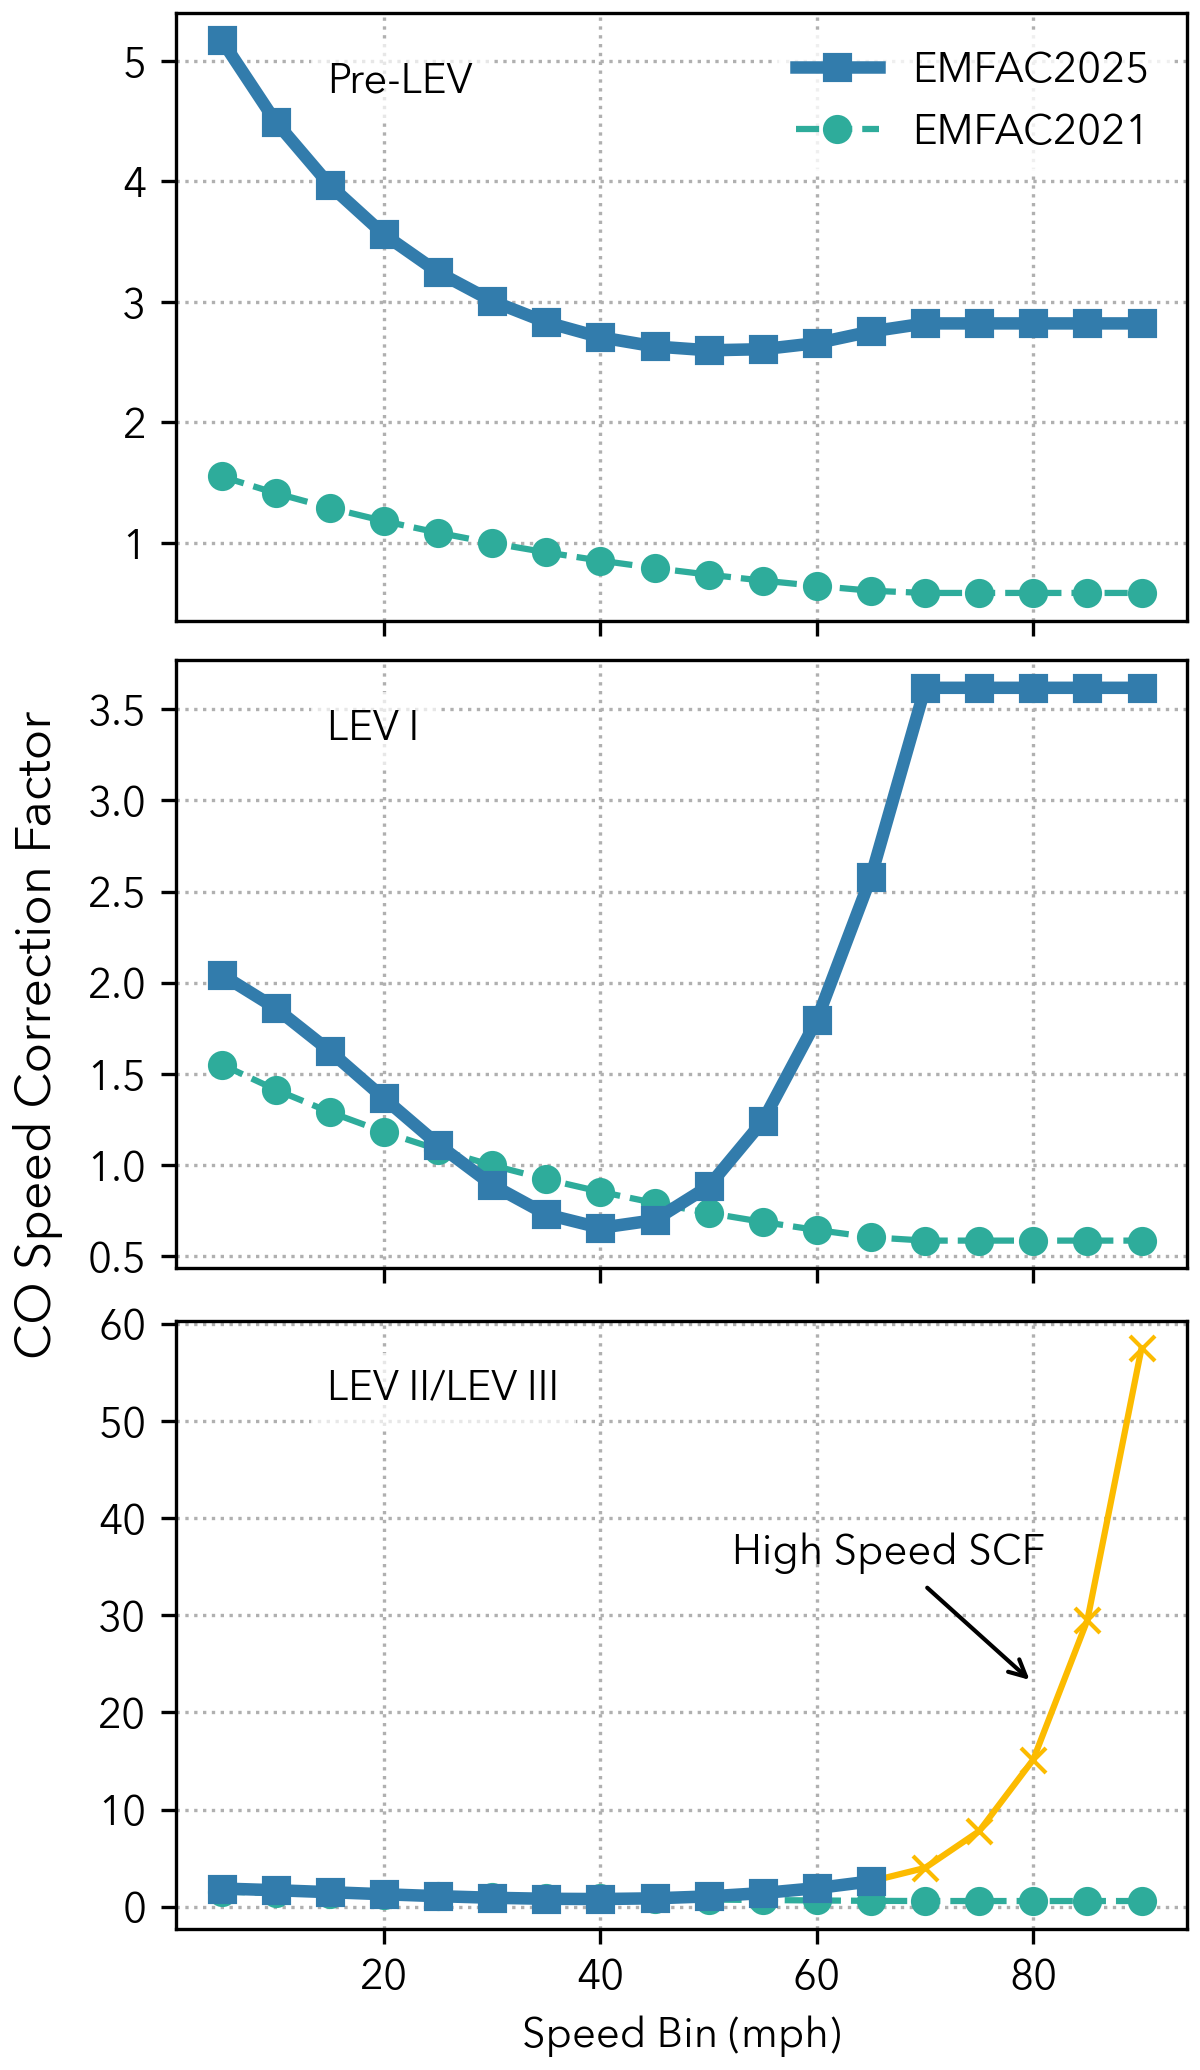
Figure 6.30: CO Speed Correction Factor: EMFAC2025 vs. EMFAC2021#