4.6. Heavy-Duty Retention Rates, New Sales, and VMT Forecasting#
4.6.1. Heavy-Duty Vehicle Retention Rates#
There are several processes that govern how vehicle populations of heavy-duty fleets change over time: 1) Increasing the population due to new sales, 2) Transfer of vehicle populations among different fleet types (e.g., CA IRP to port truck), 3) Decreasing the population due to scrappage, and 4) Decreasing in the population due to vehicles leaving the state. This information can be obtained by partitioning DMV registration data, considering vehicle vocation, operating industry, weight class, etc. Details about how DMV data are processed for heavy-duty vehicles can be found in heavy-duty fleet characterization Section 3.2.
In EMFAC, retention rates are a key intermediate parameter that helps quantify and forecast fleet population changes. The retention rate of the heavy-duty fleet is defined as the fraction of vehicles in a fleet that are retained (i.e., not sold, decommissioned, or replaced) on a yearly basis. In EMFAC2021, historical retention rates were calculated by the EMFAC vehicle category, using DMV registration data. Historical retention rates up to the base year were then used to calculate the forecasted vehicle populations. In EMFAC2025, the partitioning of heavy-duty fleet is further improved by considering fleet size, distinguishing larger fleet from smaller fleets with a threshold of 50 vehicles, based on Advanced Clean Fleets regulation. While CARB withdrew their waiver for the high priority fleets and drayage trucks requirements of the ACF regulation, the differentiated retention rates for larger fleets versus smaller fleets were still included in the EMFAC2025 model. This is due to the unique scrappage patterns between large and small fleets.
The methodology for back-calculating retention rates remains consistent between public and private sectors, with datasets differing. For public fleets, DMV registration data are used. For private fleets, CARB procured business ownership and address information from Dun & Bradstreet (D&B). Addresses from D&B were joined with DMV registration address to determine the fleet size of a certain private fleet operator. Therefore, in EMFAC2025, each non-public heavy-duty vehicle category has two sets of retention rates, one for fleets with 50 or more vehicles, and the other with less than 50 vehicles. The drayage fleet is an exception that does not have subcategories by fleet size.
For each vehicle category, staff used multi-year registration data to determine the year-over-year retention rates by model year and then averaged these rates across all model years. For instance, if the model year 2020 population was 1,000 in 2020, 900 in 2021, and 850 in 2022, the year-over-year survival rate would be 90% for age 1 (900/1000) and 94% for age 2 (850/900). Table 4.11 lists each heavy-duty vehicle category in EMFAC, and sources used for any updates made.
EMFAC2025 Vehicle Category |
Data Sources used to Update Retention Rates |
|---|---|
All Other Buses |
Unchanged from EMFAC2021 |
Motor Coach |
|
SBUS |
|
T6 OOS Class 4 |
|
T6 OOS Class 5 |
|
T6 OOS Class 6 |
|
T6 OOS Class 7 |
|
T7 NNOOS Class 8 |
|
T7 NOOS Class 8 |
|
T6 CAIRP Class 4 |
Updated and sub-categorized using Dun & Bradstreet (D&B) dataset |
T6 CAIRP Class 5 |
|
T6 CAIRP Class 6 |
|
T6 CAIRP Class 7 |
|
T6 Instate Delivery Class 4 |
|
T6 Instate Delivery Class 5 |
|
T6 Instate Delivery Class 6 |
|
T6 Instate Delivery Class 7 |
|
T6 Instate Other Class 4 |
|
T6 Instate Other Class 5 |
|
T6 Instate Other Class 6 |
|
T6 Instate Other Class 7 |
|
T6 Instate Tractor Class 4 |
|
T6 Instate Tractor Class 5 |
|
T6 Instate Tractor Class 6 |
|
T6 Instate Tractor Class 7 |
|
T6 Utility Class 4 |
|
T6 Utility Class 5 |
|
T6 Utility Class 6 |
|
T6 Utility Class 7 |
|
T7 CAIRP Class 8 |
|
T7 Single Concrete/Transit Mix Class 8 |
|
T7 Single Dump Class 8 |
|
T7 Single Other Class 8 |
|
T7 SWCV Class 8 |
|
T7 Tractor Class 8 |
|
T7 Utility Class 8 |
|
T7 Other Port Class 8 |
Updated using Dun & Bradstreet (D&B) dataset without fleet size specification |
T7 POAK Class 8 |
|
T7 POLA Class 8 |
|
T6 Public Class 4 |
Updated using DMV data without fleet size specification |
T6 Public Class 5 |
|
T6 Public Class 6 |
|
T6 Public Class 7 |
|
T7 Public Class 8 |
4.6.2. Heavy-Duty New Vehicle Sales Forecasting#
EMFAC2025 continues to use the heavy-duty new vehicle sales forecasting method used in EMFAC2021, EMFAC2017, and EMFAC2014; refer to Section 3.3.4.1.2.1 of the EMFAC2014 Technical Documentation (CARB, 2015). The forecasting method begins with the national heavy-duty new vehicle sales growth trend, which is obtained from the 2023 Annual Energy Outlook (AEO) report from the U.S. Energy Information Administration (EIA). The national VMT and new sales growth trends are shown in Figure 4.20 and are referenced to the base year 2022. After which, these numbers are converted to California specific new HD vehicle sales growth trends using the ratio of national VMT growth based on AEO data vs. California’s VMT growth.
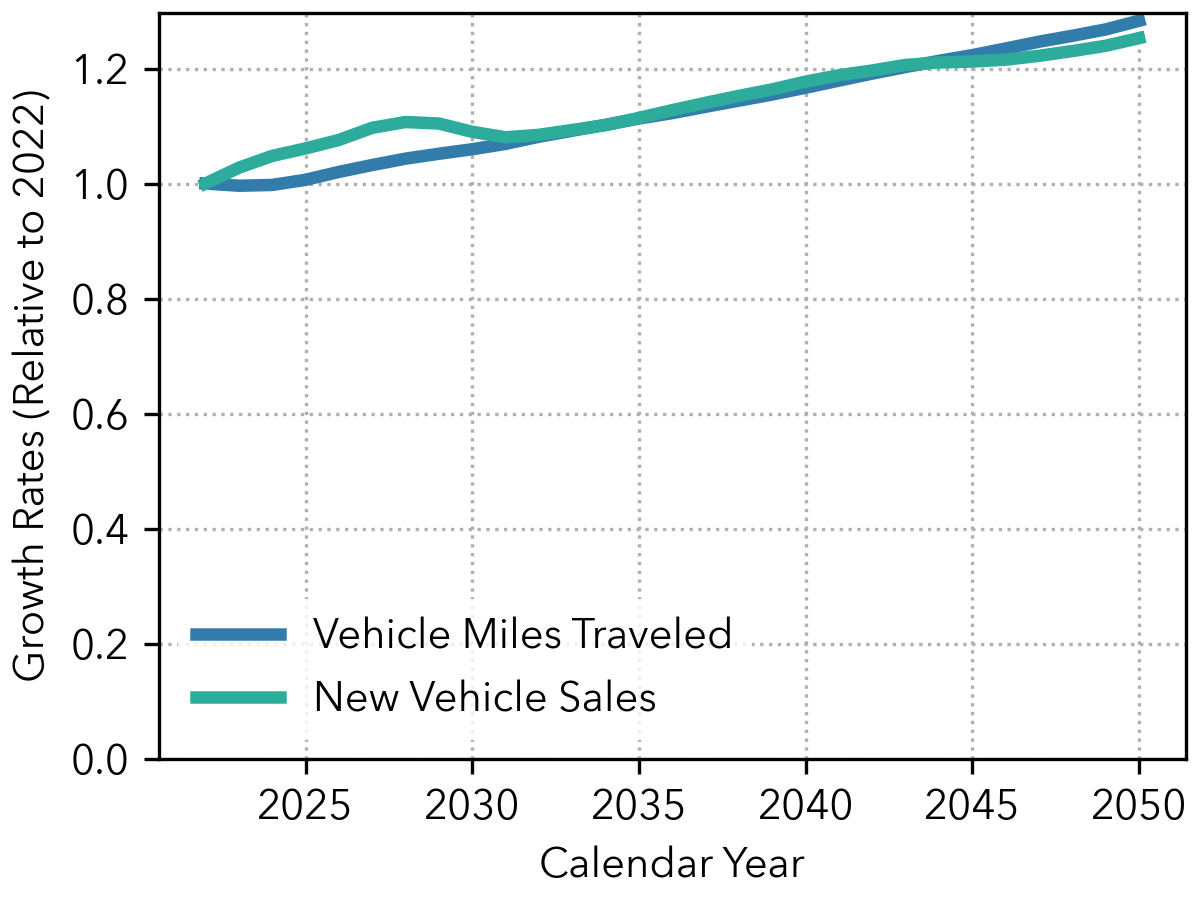
Figure 4.20: Heavy-Duty New Vehicle Sales and VMT Growth Rates Relative to Base Year (2022)#
While the new sales forecasting methodology has not changed, EMFAC2025 now uses the average new vehicle sales for the previous 3 calendar years (2020–2022), rather than just using the base year new vehicle sales as the starting point for new sales growth. This was done due to the unique trends in vehicle purchasing of heavy-duty vehicles. New vehicle sales trends show that for heavy-duty vehicles, it is more common to have large purchases of vehicles from fleet operators in certain calendar years, and little to no purchases in other calendar years. This trend is especially prominent at the GAI level where some vehicle categories could have no new sales in the base year. This has led to some inconsistencies in new vehicle sales with previous versions of EMFAC, where some vehicle categories had declines in total populations in the forecasted years, due to there being no new sales in the base year. The three-year average approach has alleviated this issue as now some of the intermittent large vehicle purchases are being captured for new vehicle sales forecasting.
4.6.3. Vehicle Miles Traveled Forecasting#
EMFAC2025 continues to use the same forecasting methodology for VMT as what was used in EMFAC2021. County level VMT growth rates are extracted from the California Statewide Travel Demand Model (CSTDM) to forecast VMT from 2020 to 2050. Since the CSTDM model has not had a new release since EMFAC2021, the same forecasted growth rates are used in EMFAC2025. See section 4.5.2 in the EMFAC2021 documentation for more details on this methodology.
4.6.3.1. Drayage Trucks#
EMFAC2025 continues to use the same forecasting methodology as EMFAC2021, EMFAC2017, and EMFAC2014 for VMT growth rates for drayage trucks. The 2016 International Mercator Forecast was used to project drayage truck VMT growth operating at Port of Los Angeles (POLA) and Port of Long Beach (POLB). For POLA and POLB, it is expected that they will reach their capacity limit in 2035, and thus growth rates for these ports is zero for calendar year > 2035. For the Port of Oakland (POAK), growth rates are based on the moderate growth rate scenario described in the 2019-2050 Bay Area Seaport Forecast Report. “Other Ports” drayage category uses growth rates from POLA, POLB, and POAK that are adjusted by the twenty-foot equivalent unit (TEU) proportions.
4.6.3.2. Construction and Motor Coach Buses#
The VMT growth rates for construction and motor coach buses in EMFAC2025 were updated using projected growth in these sectors from UCLA Anderson’s Annual Economic Forecast 2022. Year to year growth rates from UCLA’s forecast are used to forecast VMT growth. The T7 Single Concrete/Transit Mix and the T7 Single Dump Fleets computed VMT growth rates using the construction employment data. The Motor Coach Bus Fleet computed VMT using the leisure/hospitality employment data.
4.6.3.3. Public, Utility, and Solid Waste Collection Vehicles (SWCV), All Other Buses, and School Buses#
EMFAC2025 uses the same methodology for forecasting VMT of public, utility, SWCV, and all other buses as EMFAC2021 and is assumed to follow the DOF-based statewide human population. These were updated to the data release from DOF from 2022, which forecasts population data for calendar year > 2023. The most recent DOF data shows a sharp decline in projected population when compared to the DOF data used for EMFAC2021. This has lead to a moderate decline in VMT growth forecasted for public, utility, SWCV, and all other buses. The school bus growth rates to forecast VMT are set at 1.0 (as it was in EMFAC2021 and EMFAC2017), reflecting no projected growth.