5.1. Diesel Heavy Heavy-Duty Vehicles#
To support CARB regulatory programs and better serve stakeholder needs, staff carried out multiple in-house projects as well as extramural contracts to test in-use heavy-duty diesel trucks and collect emissions data using Portable Emissions Measurement Systems (PEMS) and chassis dynamometers.
A chassis dynamometer is a testing device designed to replicate the resistance and inertia that a vehicle experiences during real-world driving conditions, particularly in urban environments. The vehicle is placed on rollers that simulate road load, allowing it to be driven in place while following a predefined driving cycle. Throughout the test, emissions analyzers continuously measure exhaust pollutants either in real time or through composite sampling, providing critical data on the vehicle’s emission performance under controlled but realistic conditions.
PEMS are advanced, portable devices used to measure real-world vehicle emissions during actual on-road operation. Unlike laboratory-based testing on dynamometers, PEMS enables direct measurement of tailpipe pollutants under in-use driving conditions, including variations in speed, load, terrain, and ambient temperature. Numerous publications have focused on emission measurement under real-world driving conditions using PEMS (Zhu et al., 2024, McCaffery et al., 2021), and the available results provide data support for vehicle pollution control.
While dynamometer data provides standardized and repeatable data sources, PEMS data offer continuous measurements, which expand the dataset and improve representation of real-world conditions. For EMFAC2025, incorporating both data types is essential to ensure the model captures more representative emission rates across the vehicle fleet. To support this goal, CARB staff compiled a comprehensive dataset from three different data sources:
In-Use Testing Program for Heavy-Duty Diesel Engines and Vehicles (HDIUT): In June 2005, the U.S. EPA adopted a manufacturer-run in-use testing program, titled In-Use Testing Program for Heavy-Duty Diesel Engines and Vehicles (HDIUT). HDIUT requires engine manufacturers to measure and report in-use exhaust emissions from heavy-duty vehicles using onboard PEMS during typical over-the-road operation. Upon receipt of all the data and required information from the engine manufacturers, CARB examines the data and verifies that the emissions meet the in-use emissions standards and test requirements. HDIUT provides a large dataset (500+) to evaluate heavy-duty vehicle in-use behavior (CARB, 2024), and supported the EMFAC2025 diesel heavy-duty speed correction factor update.
The Heavy-Duty Truck and Bus Surveillance Program (TBSP): The Heavy-Duty Truck and Bus Surveillance Program (TBSP) is a program run by the California Air Resources Board (CARB) to monitor and reduce emissions from heavy-duty trucks and buses. Each vehicle is tested on a chassis dynamometer as well as on the road utilizing PEMS for multiple runs. The paired dataset of on-road and laboratory dynamometer testing provides a stronger basis for incorporating a combination of both data sources into EMFAC, rather than relying solely on either on-road or laboratory data. All chassis dynamometer tests used the Burke E. Porter heavy-duty chassis dynamometer at the CARB Depot Park Facility. The heavy-duty chassis dynamometer simulates road load forces equivalent to approximately 80% of the vehicle’s Gross Vehicle Weight Rating (GVWR), which corresponds to about 65,000 lbs. for HHD vehicles with the maximum GVWR. The Chassis Urban Dynamometer Driving Schedule (UDDS) is conducted under hot-start conditions. This test cycle represents one of the duty cycles that heavy-duty trucks may undergo in the real world and helps better understand the relationship between average vehicle speed and emissions to better estimate the current running emission incorporated in EMFAC2025. Each vehicle was tested 10–20 times under a total of 14 individual test conditions: AM/PM, City/Highway, Origin/Destination (in-bound/out-bound), with each PEMS test lasting 1–2 hours. Figure 5.1 presents the speed profile along one of the test routes.
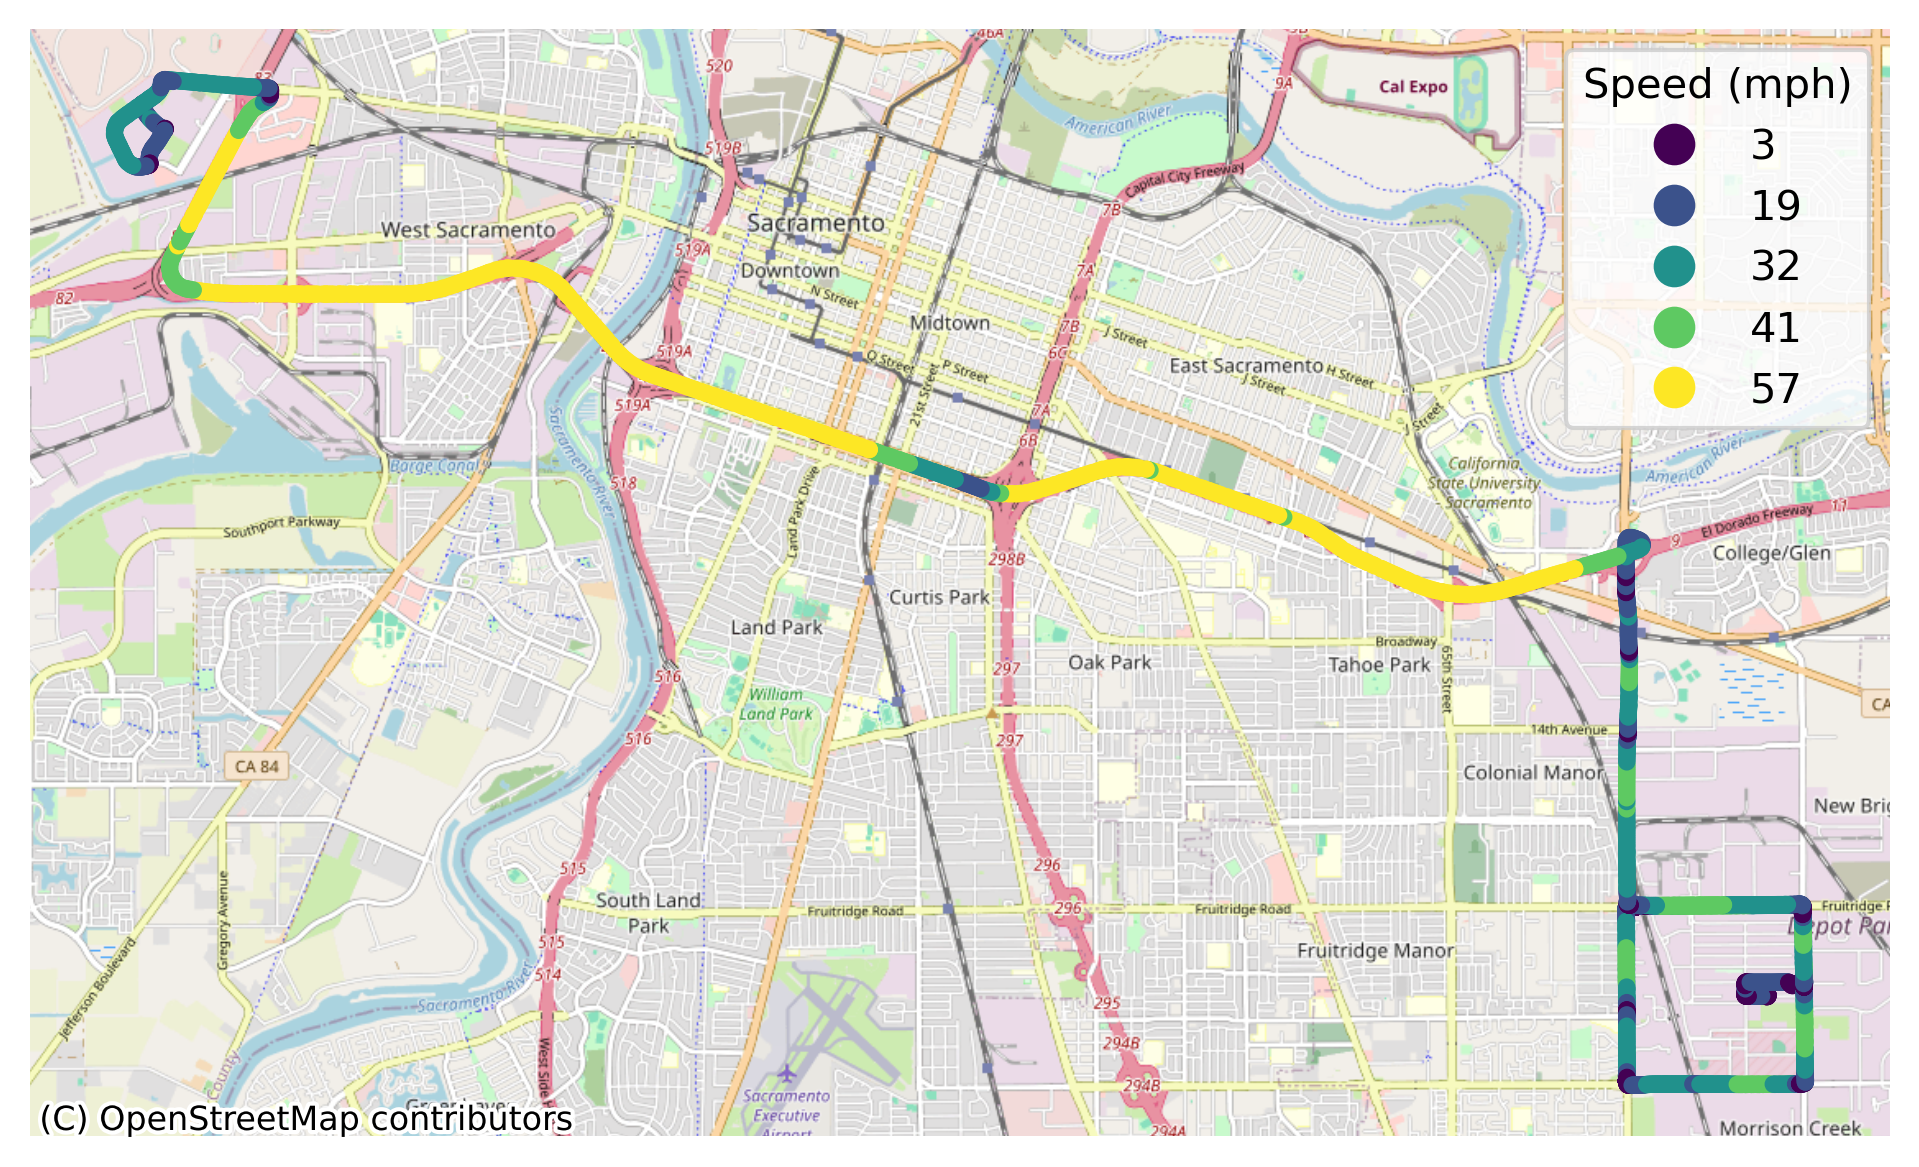
Figure 5.1: Speed Profile Along a Test Route Used for Portable Emission Measurement Systems (PEMS) Testing in CARB’s Heavy-Duty Truck and Bus Surveillance Program (TBSP)#
200-vehicle PEMS study: A real-world emissions testing program for heavy-duty vehicles (HDV) was conducted by the University of California, Riverside (UCR), in collaboration with West Virginia University (WVU). Spanning from 2017 to 2022, this program assessed over 200 HDVs across various vocations and fuel technologies under actual operating conditions. Measured emission levels varied widely across different duty cycles, test methods, engine/fuel technologies, and vocations. Heavy-duty vehicles tested ranged from model year 2001 to 2019, and most exhibited elevated in-use emissions under operational conditions different than the certification cycle. More information and results of the project can be found in the California Energy Commission’s report (Leonard et al., 2023).
5.1.1. Diesel Heavy-Duty Start Emission Rates Update#
The start emission update is based on ten model year 2013 and newer Class 7 & 8 vehicles from TBSP PEMS tests. The dataset is identical to that used in EMFAC2021, except for the removal of one vehicle test due to a subsequent engine recall.
The PEMS dataset provides time-series measurements of exhaust temperature and cumulative NOx emissions from the moment the truck engine is started. It is important to distinguish between the start emission and running emission periods because they are governed by different engine operating conditions and control strategies. Start emissions typically occur when the engine and aftertreatment systems, such as Selective Catalytic Reduction (SCR), are not yet fully warmed up, leading to disproportionately high NOx emission rates. In contrast, running emissions reflect stabilized engine operation and more effective emission control performance. Accurately separating these two periods is crucial for modeling emissions, evaluating regulatory compliance, and designing effective mitigation strategies. In EMFAC2021, staff manually reviewed the data to identify the start emission period. In EMFAC2025, CARB staff apply a new methodology to re-analyze the same dataset with standardized criteria to identify the start emission period. The end of the start emission period is identified using the following criteria, with the earliest occurring event determining the cutoff:
The detection of the first cumulative NOx plateau, defined as a change of less than 0.03 grams over a duration of at least 100 seconds
The moment when the exhaust temperature reaches 200 °C
A maximum elapsed time of 20 minutes after engine start
Figure 5.2 shows a case when cumulative NOx plateau occurs at around 500 seconds, before the exhaust temperature reaches 200 °C or the 20-minute mark. Thus, the first 500 seconds are identified as the start emission period, while the period after 500 seconds is considered the running emission period.
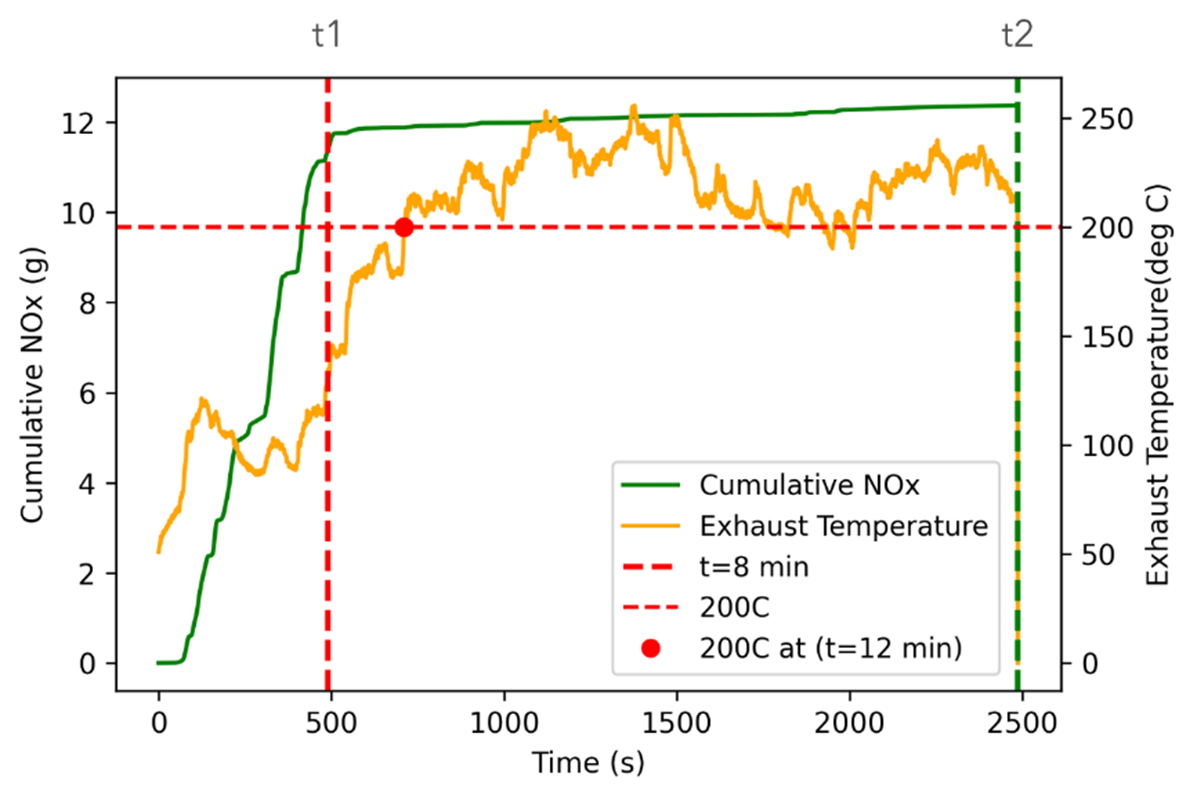
Figure 5.2: Cumulative NOx Emissions Separated into Two Phases: the Start-up Period and the Running Period#
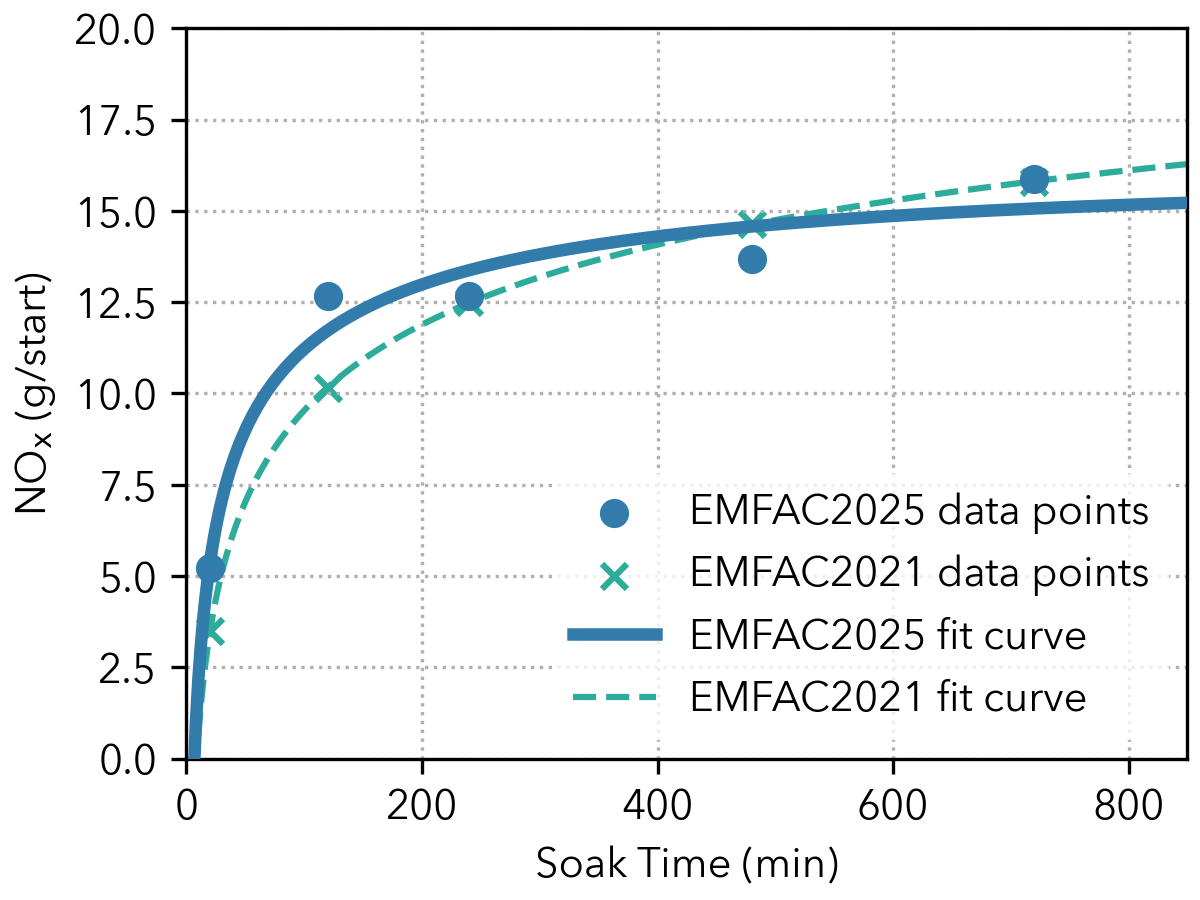
Figure 5.3: NOx Start Emissions as a Function of Soak Time for Heavy-Duty Diesel Trucks: EMFAC2021 vs. EMFAC2025#
Start emissions are calculated based on Equation (5.1). The NOx emissions during the start phase are considered to include start emissions as well as running exhaust emissions, which are emissions that would otherwise be emitted had the SCR reached operating temperatures. Thus, start emissions are obtained by subtracting the NOx running emissions from the total emissions of the start phase. A detailed discussion can be found in Section 3.2.3.6 of the EMFAC2014 technical documentation (CARB, 2015).
Soak time refers to the length of time the engine and aftertreatment system (SCR) have been turned off and allowed to cool before the engine is started again. Each vehicle was tested 5 times under different soak times, and the final start emission data points are shown in Figure 5.3 and Table 5.1; each data point represents the average NOx start emission across all 10 vehicles under a specific soak time.
Soak time |
20 min |
120 min |
240 min |
480 min |
720 min |
|---|---|---|---|---|---|
EMFAC2025 |
5.22 |
12.68 |
12.68 |
13.67 |
15.87 |
EMFAC2021 |
3.49 |
10.14 |
12.51 |
14.63 |
15.80 |
5.1.2. Analysis of Diesel Heavy-Duty Running Emissions From PEMS Testing#
After identifying the start and running emission periods, the start period was excluded from the dataset. A micro-trip-based methodology was then applied to estimate the running emission rate as follows:
Aggregate second-by-second PEMS data points into micro-trips (Figure 5.4)
Exclude extended idling events (i.e., a continuous segment of vehicle activity that meets all three criteria: all instantaneous vehicle speeds being lower than 5 mph, the total distance of less than 1 mile, and the total duration of more than 5 minutes)
Merge trips < 0.25 miles
Split trips > 3 miles
Aggregate micro-trip level data into speed bins of 5 mph
Develop a function of emission rate based on speed (Figure 5.5 shows a marked improvement in \(R^2\) of the fitted curve after aggregating the data points into speed bins of 5 mph)
Determine the base emission rate at 18.8 mph based on the fitted curve (18.8 mph represents the average speed while the vehicle is in motion during the UDDS cycle. This speed reflects typical urban driving conditions under chassis dynamometer testing and ensures consistency and compatibility when integrating PEMS data with dynamometer-based emission rates.)
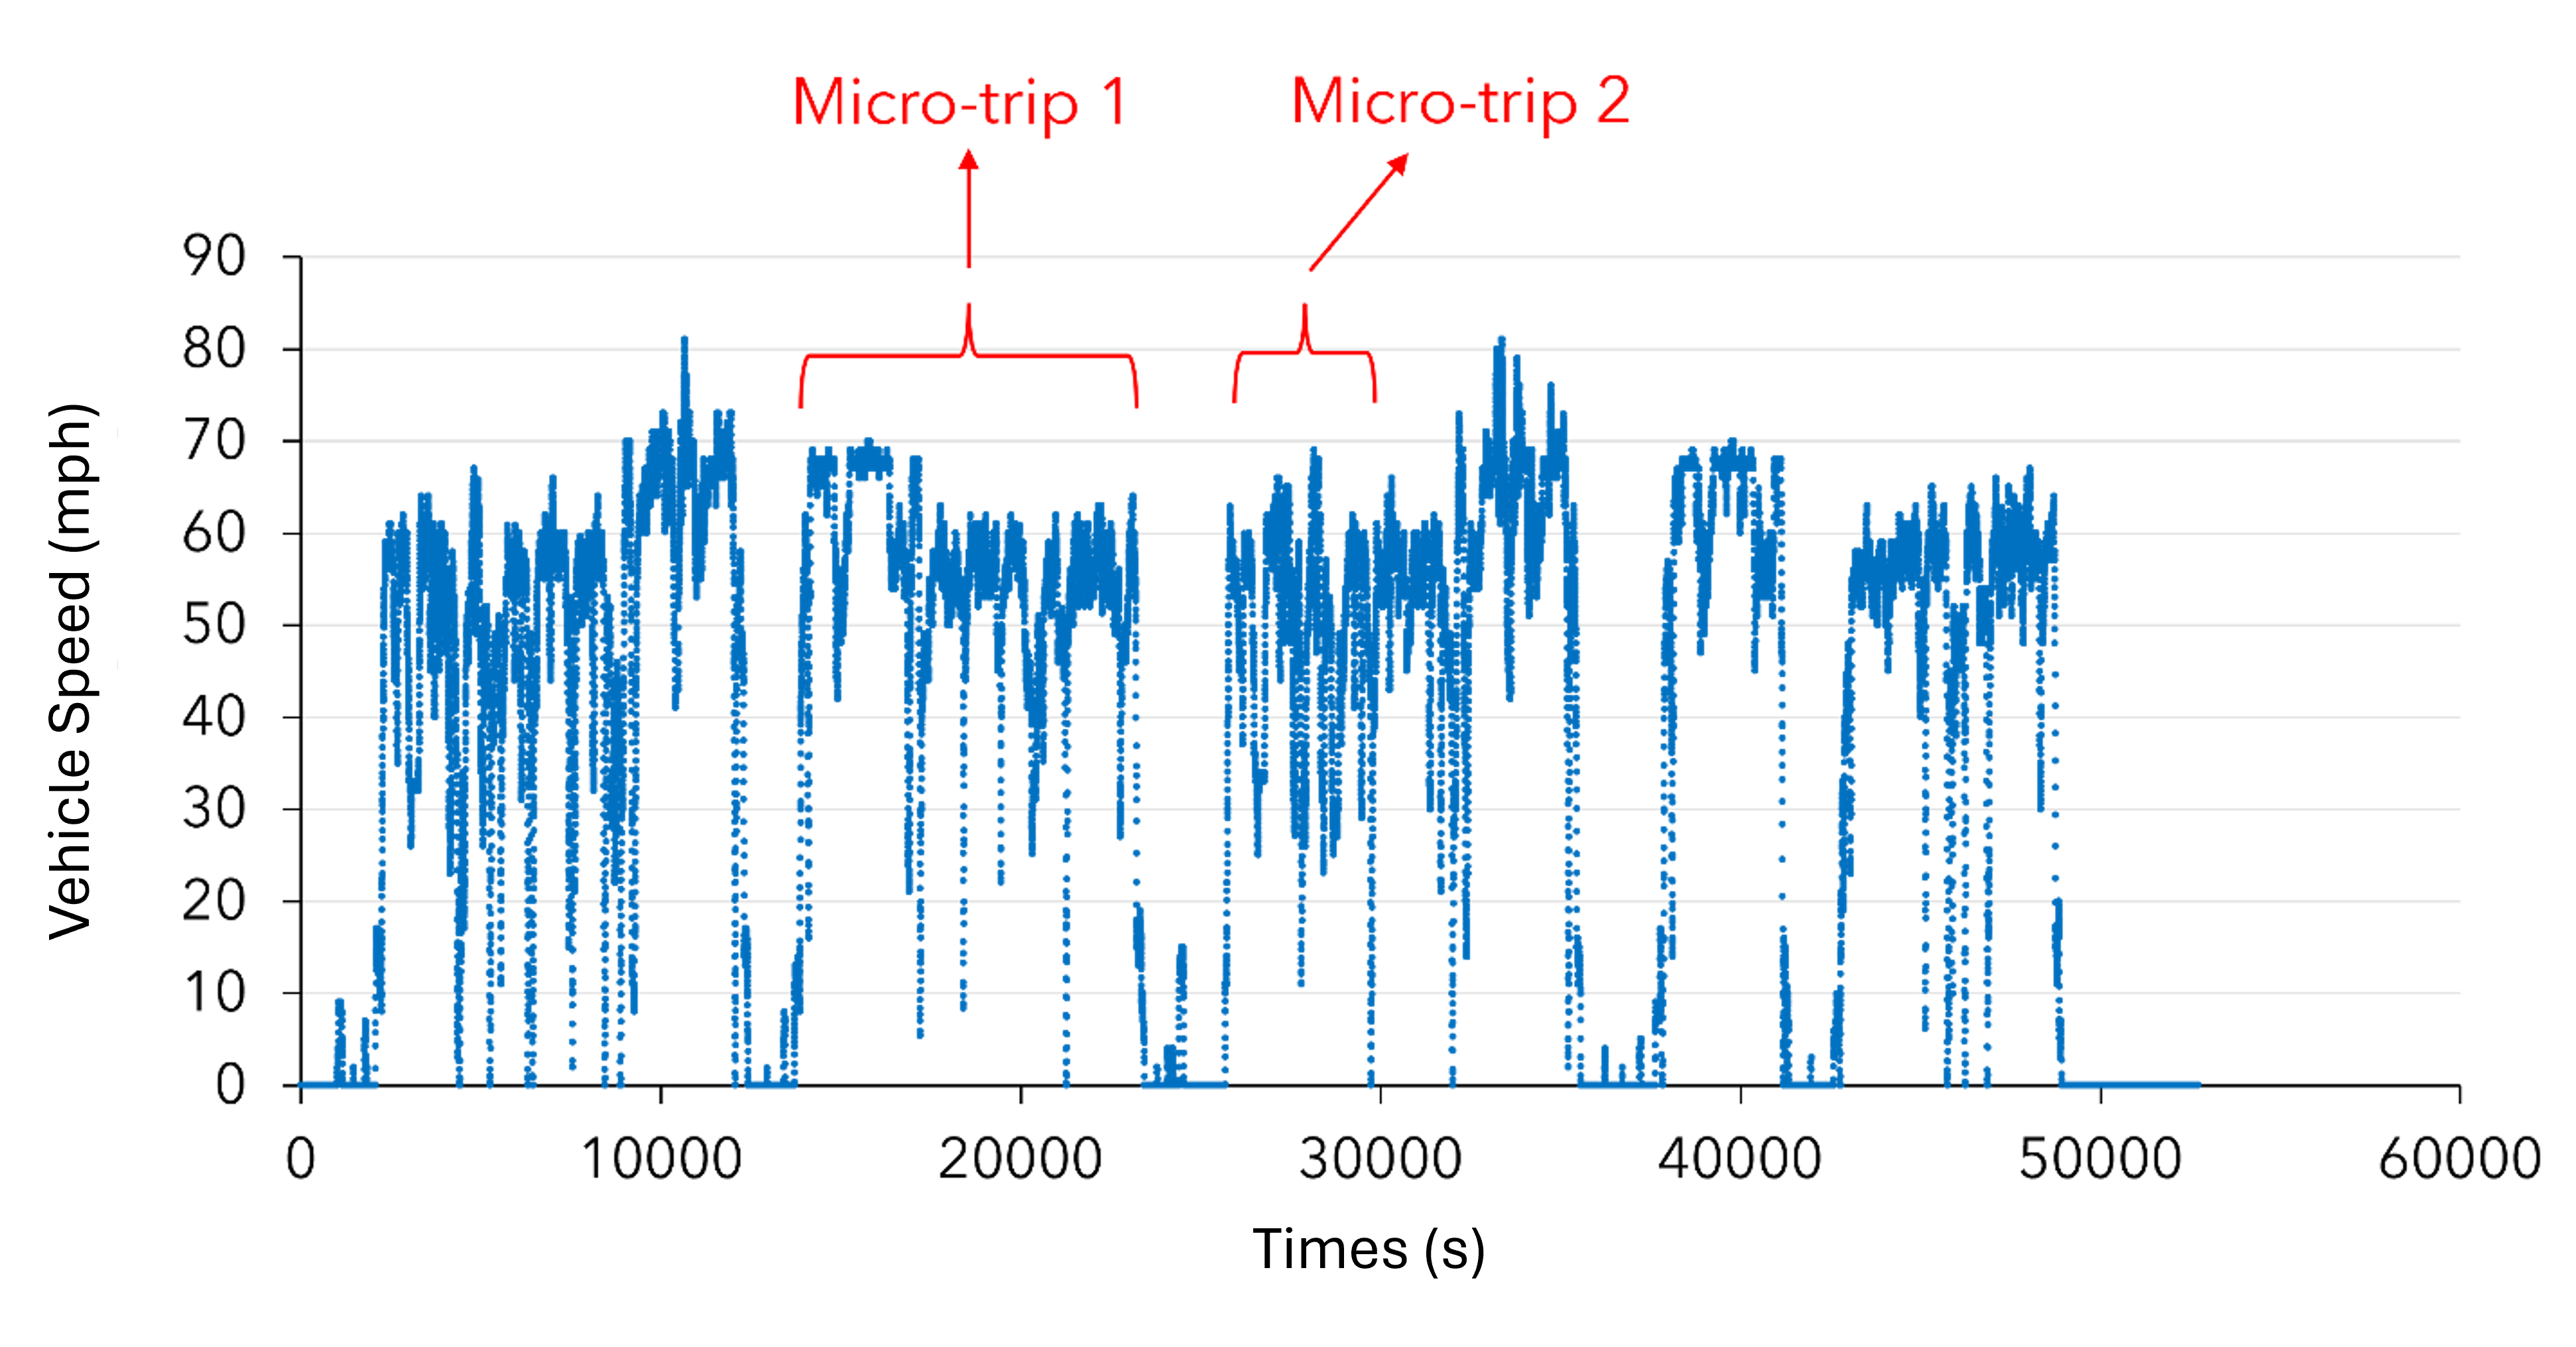
Figure 5.4: Aggregate the Second-By-Second PEMS Data Points into Micro-Trips#
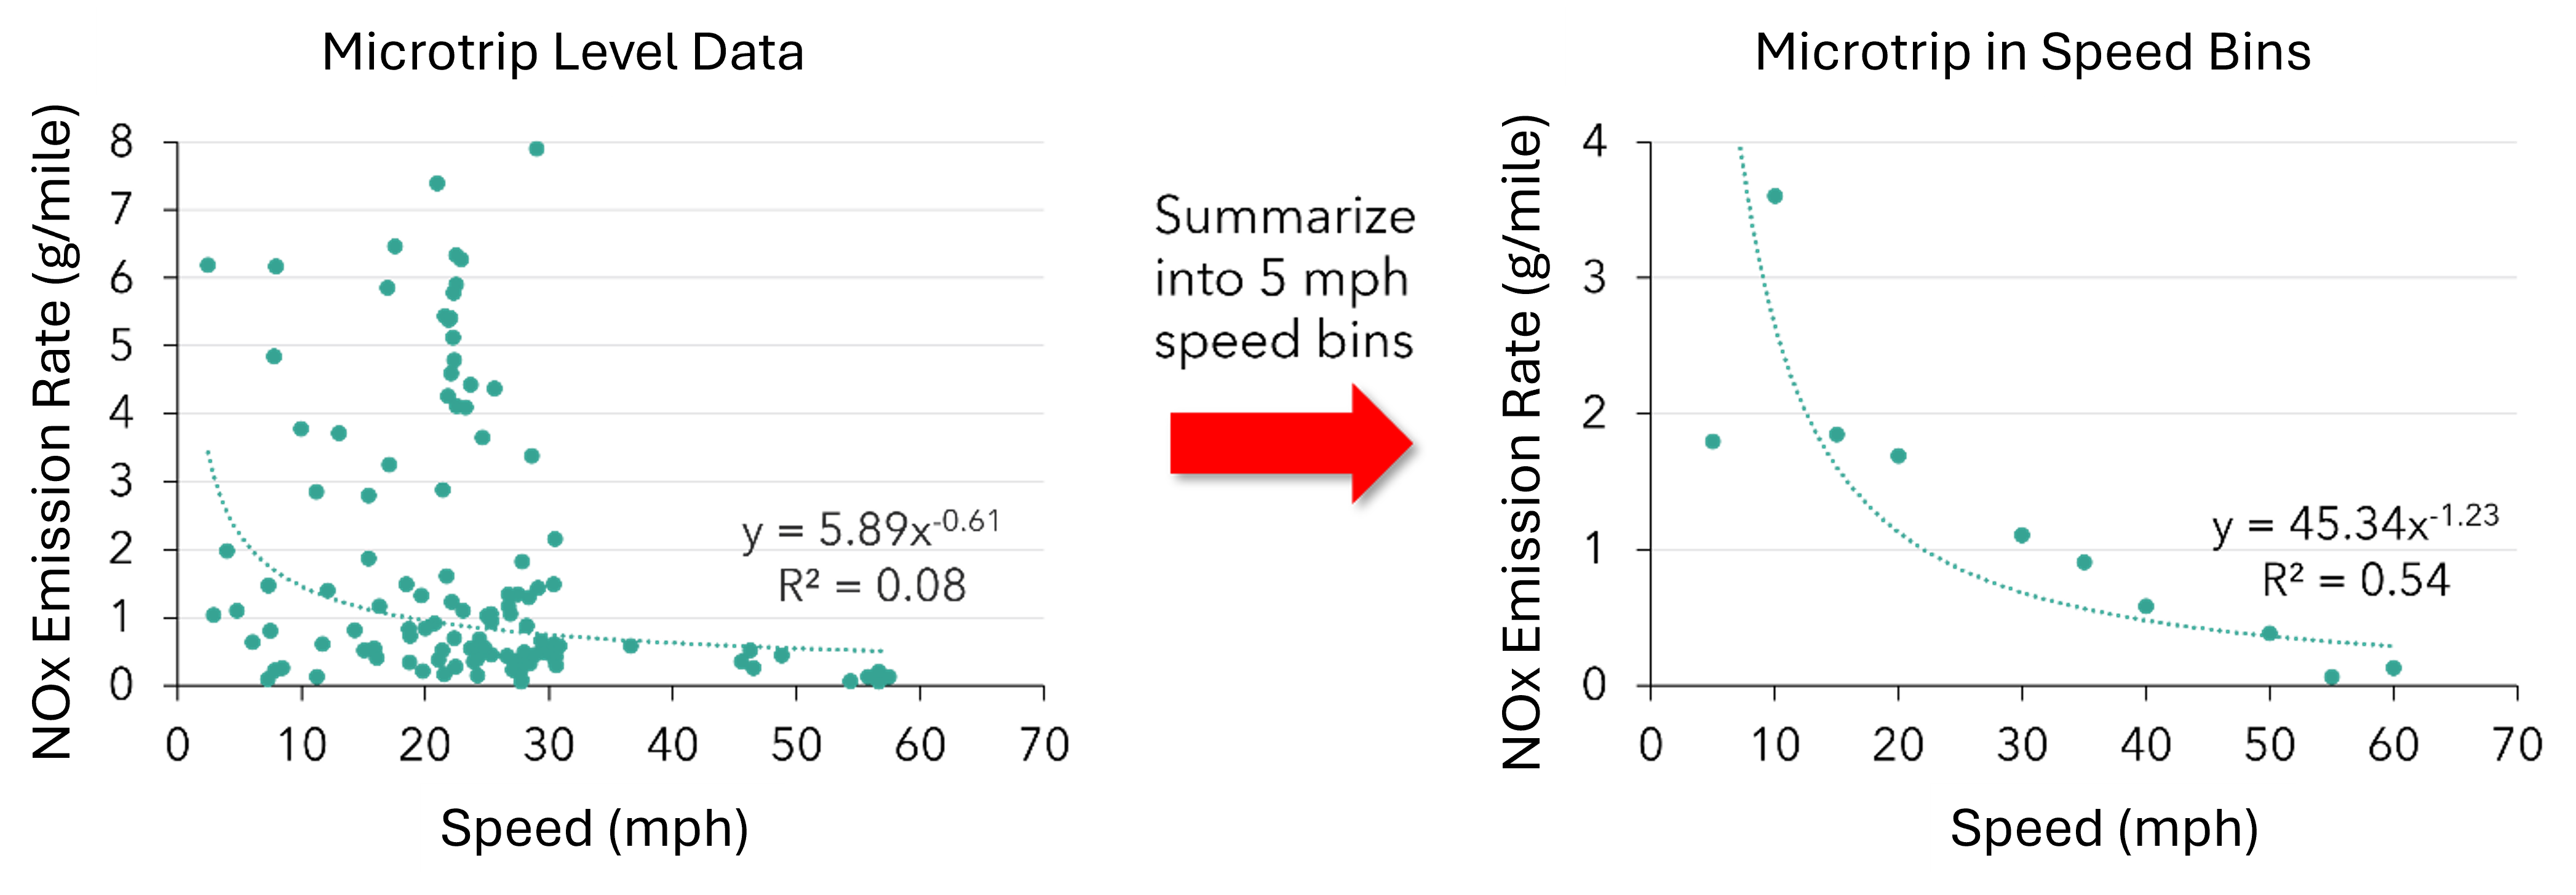
Figure 5.5: Aggregate Micro-Trip Level Data into Speed Bins of 5 mph and Develop a Function of Emission Rate#
The objectives of applying this micro-trip methodology are:
To derive a representative emission rate under stabilized engine operation, excluding idling events under heavy traffic;
To integrate the real-world PEMS test results with laboratory-tested dynamometer data, since micro-trips resemble the pattern of dynamometer drive cycles.
The methodology also leverages the high temporal resolution advantage of PEMS data while minimizing uncertainties and fluctuations associated with second-by-second measurements. The tested vehicle information and the sample size are listed in Table 5.2.
The average odometer reading for all data analyzed — comprising 50% UDDS dynamometer tests and 50% PEMS tests as listed in Table 5.2 — is 143,351 miles, with an average NOx emission rate of 2.02 g/mi. (CARB staff removed all recalled vehicles from the analysis in EMFAC2025.) This emission rate derived from PEMS and chassis dyno was used to adjust the base emission rate at UDDS average speed in EMFAC2025. There are an increasing number of vehicles sampled with each update of EMFAC as listed in Table 5.3.
Test Type |
Vehicle ID |
Emission Rate (g/mi) |
Model Year |
Odometer Mileage |
Vehicle Class |
|---|---|---|---|---|---|
TBSP - PEMS |
18-VEH1-2 |
2.32 |
2015 |
511406 |
Class 8 |
TBSP - PEMS |
18-VEH3-1 |
0.89 |
2014 |
134539 |
Class 8 |
TBSP - PEMS |
18-VEH4-2 |
0.90 |
2015 |
128288 |
Class 8 |
TBSP - PEMS |
18-VEH6-1 |
0.69 |
2016 |
13769 |
Class 8 |
TBSP - PEMS |
18-VEH7-1 |
1.08 |
2016 |
149709 |
Class 8 |
TBSP - PEMS |
19-VEH12-1 |
0.88 |
2016 |
101767 |
Class 8 |
TBSP - PEMS |
19-VEH1-3 |
1.14 |
2015 |
128370 |
Class 8 |
TBSP - PEMS |
19-VEH7-3 |
0.50 |
2016 |
212460 |
Class 8 |
TBSP - PEMS |
19-VEH9-1 |
2.14 |
2018 |
54343 |
Class 8 |
TBSP - PEMS |
19-VEH13-1 |
2.14 |
2013 |
151150 |
Class 6 |
TBSP - Dynamometer |
M-3 |
4.23 |
2014 |
72055 |
Class 8 |
TBSP - Dynamometer |
R-2 |
0.00 |
2014 |
275565 |
Class 8 |
TBSP - Dynamometer |
R-3 |
0.71 |
2014 |
234326 |
Class 8 |
TBSP - Dynamometer |
R-1 |
0.20 |
2014 |
290981 |
Class 8 |
TBSP - Dynamometer |
V1-1 |
2.66 |
2015 |
308919 |
Class 8 |
TBSP - Dynamometer |
V1-2 |
6.33 |
2015 |
511406 |
Class 8 |
TBSP - Dynamometer |
V3-1 |
0.43 |
2014 |
134539 |
Class 8 |
TBSP - Dynamometer |
V4-1-2 |
0.12 |
2015 |
194575 |
Class 8 |
TBSP - Dynamometer |
V4-2 |
0.31 |
2015 |
128288 |
Class 8 |
TBSP - Dynamometer |
V1-3 |
3.76 |
2015 |
128370 |
Class 8 |
TBSP - Dynamometer |
V6-1 |
0.87 |
2016 |
13769 |
Class 8 |
TBSP - Dynamometer |
V7-1 |
0.36 |
2016 |
149709 |
Class 8 |
TBSP - Dynamometer |
V7-3 |
0.25 |
2016 |
212460 |
Class 8 |
TBSP - Dynamometer |
V9-1 |
4.05 |
2018 |
54343 |
Class 8 |
TBSP - Dynamometer |
V12-1 |
3.47 |
2016 |
101767 |
Class 8 |
200 Vehicle - PEMS |
V52 |
0.63 |
2015 |
26924 |
Class 7 |
200 Vehicle - PEMS |
V98 |
0.55 |
2015 |
33356 |
Class 7 |
200 Vehicle - PEMS |
V149 |
0.84 |
2015 |
81087.5 |
Class 7 |
200 Vehicle - PEMS |
V175 |
0.54 |
2015 |
73281.2 |
Class 7 |
200 Vehicle - PEMS |
V18089 |
0.50 |
2015 |
47246 |
Class 7 |
200 Vehicle - PEMS |
V88 |
4.25 |
2011 |
394408.8 |
Class 8 |
200 Vehicle - PEMS |
V18078 |
5.61 |
2010 |
428895.9 |
Class 8 |
200 Vehicle - PEMS |
V18079 |
6.48 |
2010 |
386668 |
Class 8 |
200 Vehicle - PEMS |
V5 |
5.90 |
2015 |
73279 |
Class 8 |
200 Vehicle - PEMS |
V50 |
5.13 |
2015 |
188031.5 |
Class 8 |
200 Vehicle - PEMS |
V18048 |
10.32 |
2015 |
184237 |
Class 8 |
200 Vehicle - PEMS |
V18049 |
4.93 |
2015 |
221199 |
Class 8 |
200 Vehicle - PEMS |
V18070 |
1.20 |
2015 |
330907.4 |
Class8 |
200 Vehicle - PEMS |
V18110 |
0.13 |
2015 |
68694.6 |
Class 8 |
200 Vehicle - PEMS |
V69 |
3.02 |
2016 |
42915.9 |
Class 8 |
200 Vehicle - Dynamometer |
V98 |
0.04 |
2015 |
33356 |
Class 7 |
200 Vehicle - Dynamometer |
V228 |
0.12 |
2018 |
65570 |
Class 7 |
200 Vehicle - Dynamometer |
V18093 |
0.69 |
2016 |
27414 |
Class 7 |
200 Vehicle - Dynamometer |
V54 |
7.69 |
2008 |
Class 7 |
|
200 Vehicle - Dynamometer |
V146 |
1.71 |
2010 |
85371 |
Class 8 |
200 Vehicle - Dynamometer |
V5 |
4.09 |
2015 |
73279 |
Class 8 |
200 Vehicle - Dynamometer |
V18049 |
1.7 |
2015 |
221199 |
Class 8 |
200 Vehicle - Dynamometer |
V69 |
7.8 |
2016 |
42915.9 |
Class 8 |
200 Vehicle - Dynamometer |
V85 |
0.17 |
2016 |
75715.2 |
Class 8 |
200 Vehicle - Dynamometer |
V18071 |
3.82 |
2009 |
1013134 |
Class 8 |
200 Vehicle - Dynamometer |
V57 |
4.04 |
2008 |
805011.5 |
Class 8 |
EMFAC2017 |
EMFAC2021 |
EMFAC2025 |
||
|---|---|---|---|---|
MY 2010–2012 |
MY 2013+ |
MY 2013+ |
MY 2013+ |
|
Base emission rate |
+7 |
+18 |
+26 |
+36 |
Speed correction factor |
+7 |
+18 |
+26 |
+324 |
Start emission rate |
+1 |
+3 |
+11 |
+15 |
5.1.3. Base Emission Rate and Deterioration Rate Update#
The Base Emission Rate (BER) is the fundamental emission rate per unit of activity (e.g., grams per mile) that represents the emissions from a given vehicle before applying correction factors. In EMFAC2025, diesel heavy-duty vehicle BERs were calculated by model year group using the following equation:
where ZMR = 0.60 g/mi, which is defined as the zero-mile rate (same value as EMFAC2021), DR is the deterioration rate, and SCF is the speed correction factor. This methodology is the same as EMFAC2021; more description can be found in the EMFAC2021 technical documentation.
Deterioration rate (DR) refers to the rate at which vehicle performance or emission control systems degrade over time or usage, leading to increased emissions or reduced efficiency. For example, if a new vehicle emits 0.2 g/mi NOx, and after 100,000 miles it emits 0.4 g/mi, the deterioration rate reflects this increase. DRs are calculated as follows:
where EIR is the emission impact rate at 1,000,000 miles.
EMFAC2021 used on-board diagnostics (OBD), from which the malfunction indicator lamp (MIL) status can be determined, as well as the fault codes that triggered the MIL for vehicles equipped with OBD systems that are required for engine model year 2013 and newer. The ‘MIL on’ frequency as a function of Odometer is
Next, an iterative procedure was used to determine deterioration rates from the MIL On function and in-use test data. Steps are described below:
Step 1. Initiate a base EIR and ZMR at 90,249 miles, the average odometer of the US-wide OBD dataset.
Step 2. Scale base EIR to other odometers using the MIL On function:
Step 3. Use EIRs to determine odometer-dependent emission rates:
Step 4. Calculate root mean square error (RMSE) between binned in-use NOx emission rates and the modeled values.
Step 5. Continue updating the ZMR and EIR values iteratively until RMSE reaches its minimum.
EMFAC2025 incorporated the new PEMS and chassis dyno-based NOx emission rate of 2.02 g/mi at 143,351 miles. The ZMR of 0.60 g/mi was retained, but the EIR was adjusted to fit the curve through this emission rate for engine model years 2013 and newer. To match the emission rate of 2.02 g/mi at 143,351 miles, staff solved for the EIR at this odometer, which had a value of 237%. Using the equation in Step 2, a new base EIR at 90,249 miles was calculated to be 200%, which is lower than the previous base EIR of 249%. The resulting best fit emission rate equation for heavy-duty vehicles is shown in Figure 5.6.
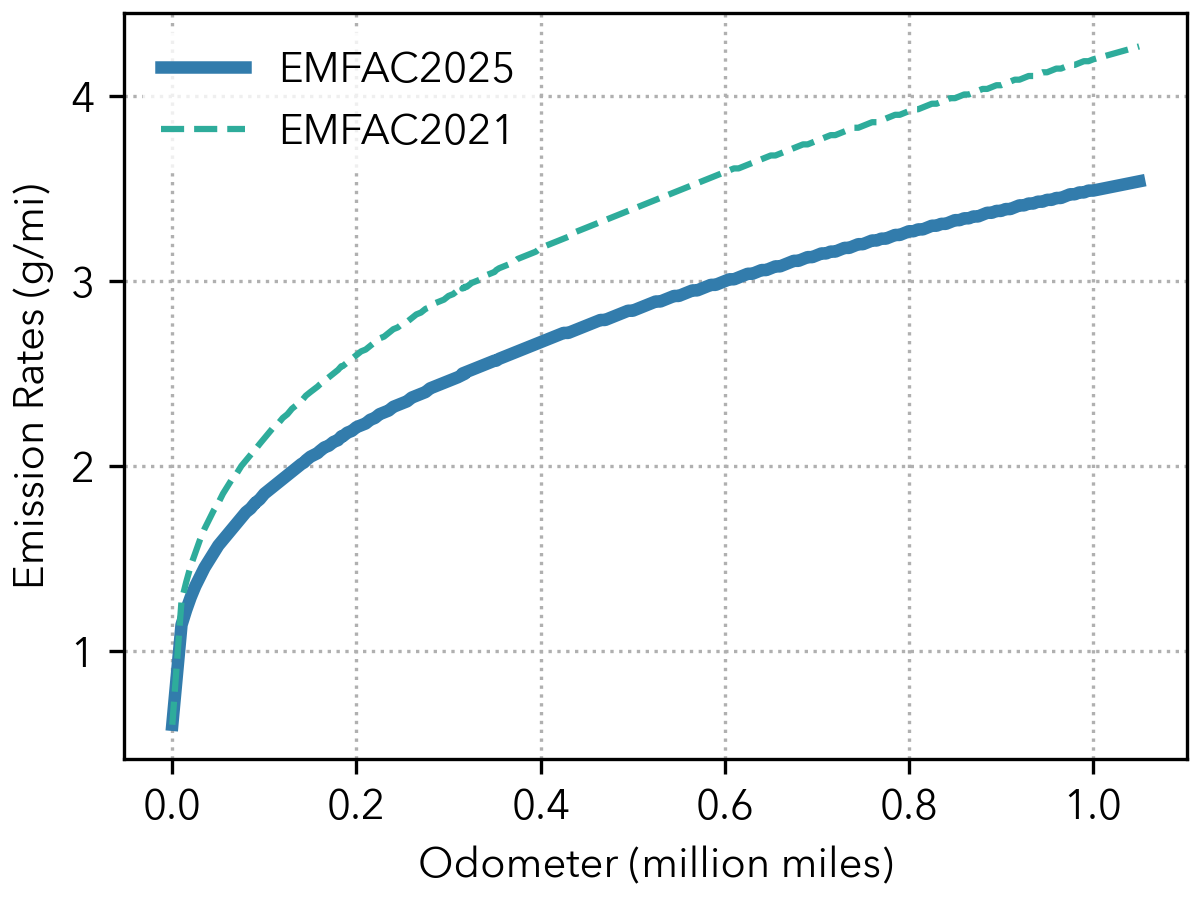
Figure 5.6: Emission Rate Deterioration Model Derived for Heavy-Duty Vehicles#
5.1.4. Speed Correction Factor Update#
Final running exhaust emissions are calculated by multiplying the base emission rate (BER) in g/mi by the vehicle miles traveled (VMT). The emission rate at a specific speed is derived by applying a speed correction factor (SCF) to the BER.
In EMFAC2021, there were only two SCFs: one for all T6 vehicles and one for all T7 vehicles, and all tested data were from dynamometer tests. For EMFAC2025, CARB staff incorporated PEMS test data of 556 vehicles from the HDIUT project to allow for more detailed SCFs by vocation and model year group.
CARB staff used the same micro-trip methodology described above to process the HDIUT PEMS data. In the EMFAC2025 input table, the SCF represents the NOx emission rate at various speeds, normalized to the emission rate at 18.8 mph. CARB staff updated medium heavy-duty (MHD) and heavy heavy-duty (HHD) trucks in model years 2010–2012 and model years 2013+ respectively. Figure 5.7 shows the change of SCFs between EMFAC2025 and EMFAC2021.
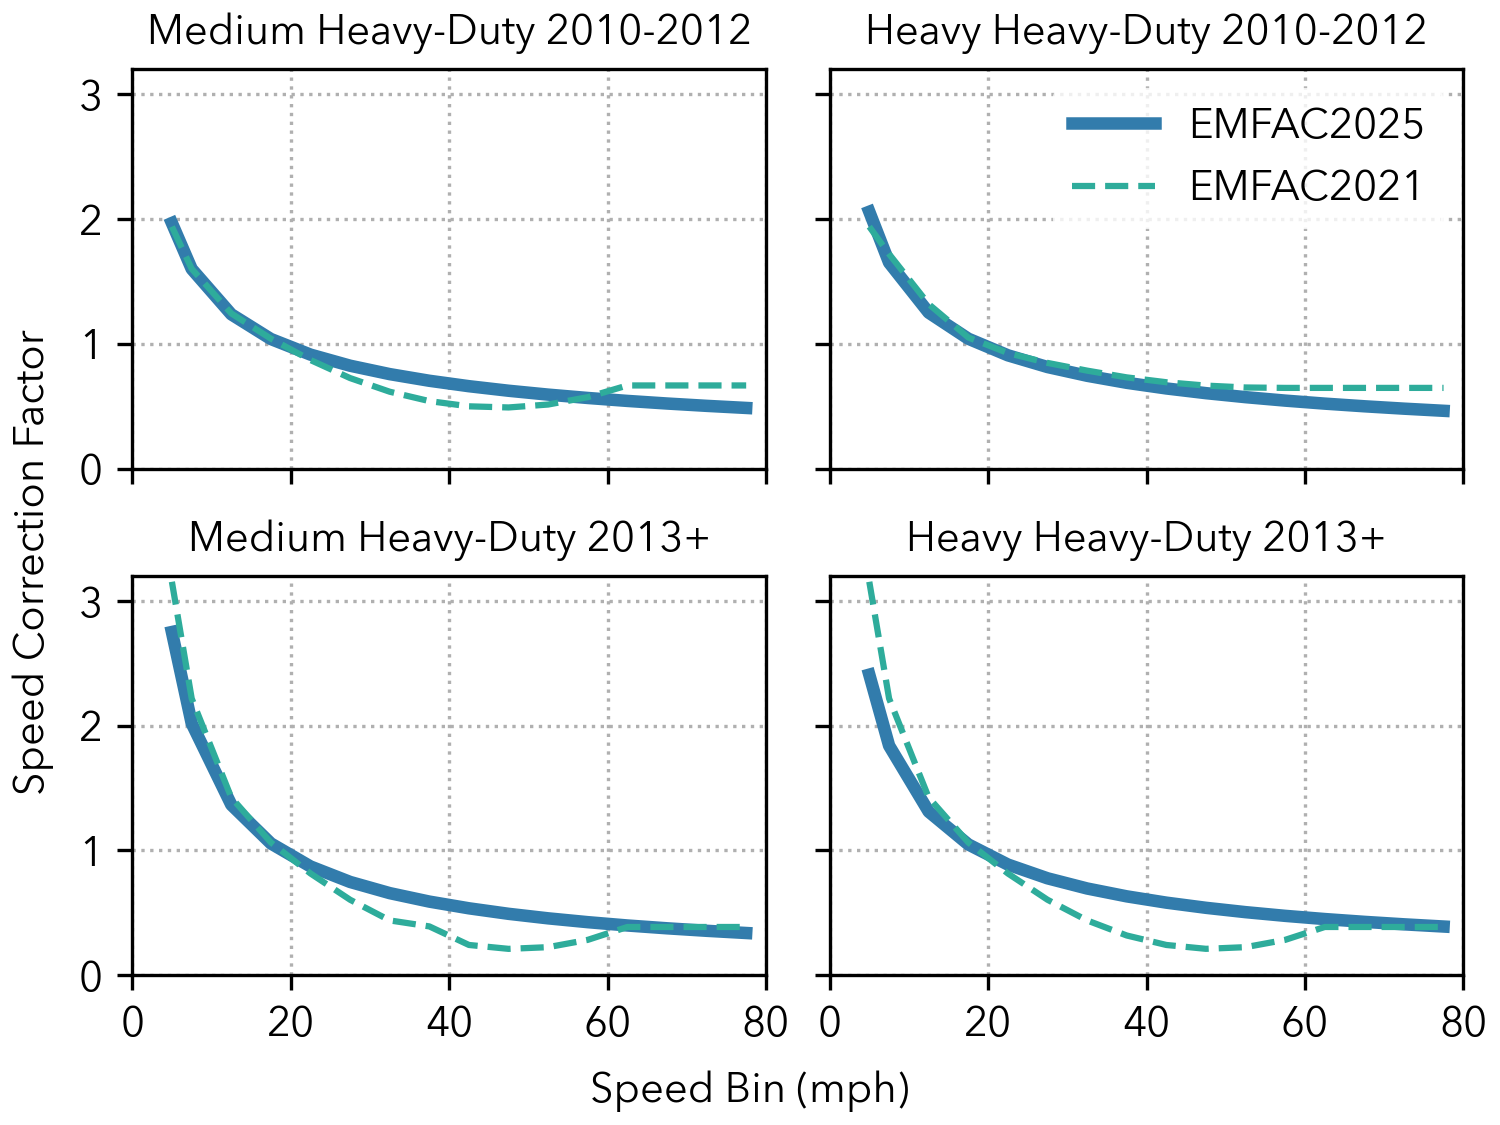
Figure 5.7: Speed Correction Factor for Medium and Heavy Heavy-Duty Vehicles: EMFAC2025 vs. EMFAC2021#