2.1. Light-Duty Vehicles of Age 45 Years and Older#
2.1.1. Background#
EMFAC2025 introduces a module to estimate emissions and activity for light-duty vehicles (LDA, LDT1, LDT2, and MDV) that are 45 years old or older (Age45+). Earlier EMFAC versions (EMFAC2021 and prior) did not include these vehicles due to their small share of the total vehicle population and the lack of reliable activity data. In calendar year 2022, approximately 540,000 light-duty Age45+ vehicles were registered, representing 2.1% of all light-duty vehicles registered at DMV. Most of these vehicles are classic cars retained for collectible or sentimental reasons, as well as older vehicles used for various purposes. As newer vehicles become cleaner, the relative contribution of these older vehicles to total emissions increases, since they generally have higher emission rates. By explicitly modeling Age45+ vehicles, EMFAC2025 further improves the accuracy of light-duty emissions inventories and provides more robust support for regulatory and air quality planning. Note that U.S. EPA’s MOVES5 model extended its previous 30-year age limit to 40 years (U.S. EPA, 2024), allowing for more accurate modeling of emissions from older vehicles.
2.1.2. Method#
EMFAC2025 estimates emissions from Age45+ vehicles by integrating DMV registration data, survey-based activity estimates, and existing emission rates in EMFAC. CARB staff used historical DMV records to estimate population and retention rates and conducted an Age45+ vehicle owner survey to determine typical usage patterns, such as annual mileage accrual and vehicle starts. Age-specific emission rates are then applied to the resulting population and activity data. This approach ensures that emissions from these rarely used but high-emitting vehicles are accurately represented in the inventory. EMFAC2025 aggregates these age-specific Age45+ vehicle population, activity, and emission rates internally and generates outputs as a single model year of age 45 for each calendar year.
2.1.2.1. Age45+ Vehicle Owner Survey#
A key challenge of modeling Age45+ vehicles is the limited availability of reliable data on their activity, such as annual mileage accrual and survival rates. Existing data sources do not fully cover this age group. For example, California’s Smog Check Program, a main source of vehicle accrual rates, only includes vehicles from model year 1976 onward. CARB also obtained mileage data for Age45+ vehicles from the Southern California American Automobile Association (AAA), but this information was limited to insurance subscribers in Southern California. Age45+ vehicles include classic cars, which are often used less frequently, stored for extended periods, and maintained differently than vehicles used for daily transportation. Other Age45+ vehicles may be used and maintained as much as newer vehicles. These factors make it challenging to estimate their activity and emission characteristics.
To address this data gap, CARB conducted a survey. CARB sent 25,000 mailouts to Age45+ vehicle owners, representing 5% of model year 1978 and older vehicles. The sample was selected randomly and stratified by county and age group using DMV vehicle registration data of year 2022. Respondents completed an online survey with seven short questions and two open-ended comment sections about vehicle use, annual mileage, storage, and start frequency.
The survey was conducted with mailings sent at the end of July 2023. Data collection occurred from August to September 2023. There were 2,960 responses, with 2,889 passing quality checks, resulting in a response rate of approximately 12%. Most respondents reported infrequent use of their vehicles, often for special occasions or leisure, and many indicated that their vehicles are stored for long periods. The results of the survey responses relevant to the implementation of Age45+ vehicles in EMFAC are summarized below.
Table 2.1 shows that the survey responses closely match the DMV2022 data for model year distributions, with only minor differences, such as a slight overrepresentation of older vehicles in the survey. Similarly, Table 2.2 demonstrates that the county distribution in the survey responses is consistent with DMV2022 data. Together, these tables indicate that the survey participants are representative of the overall Age45+ vehicle population in California, providing confidence in the reliability of the survey data for estimating Age45+ vehicle activity and emissions.
Model Year |
DMV Database |
Survey Responses |
|---|---|---|
1910s or older |
0.1% |
0.1% |
1920s |
1.3% |
1.8% |
1930s |
4.2% |
5.6% |
1940s |
3.8% |
4.5% |
1950s |
13.8% |
15.3% |
1960s |
42.0% |
41.4% |
1970s |
34.8% |
31.4% |
County |
DMV2022 |
Survey Responses |
|---|---|---|
Los Angeles |
21% |
17% |
San Diego |
8% |
8% |
Orange |
7% |
7% |
Riverside |
5% |
5% |
Sacramento |
5% |
5% |
Santa Clara |
4% |
4% |
San Bernardino |
5% |
4% |
Alameda |
3% |
3% |
Other counties |
42% |
47% |
Table 2.3 summarizes the annual mileage accrual rates from the survey. CARB staff reviewed the data and excluded responses with obvious errors or invalid values, resulting in 2,767 valid responses. The median annual mileage is 300 miles, while the mean is 786 miles. The first quartile is 100 miles, and the third quartile is 1,000 miles. The distribution is skewed, indicating that while most Age45+ vehicles are driven very little, a small subset are reported to be driven significantly more, with some reaching up to 26,000 miles per year.
Statistic |
Value |
|---|---|
Counts |
2,767 |
Minimum |
0 |
1st Quartile |
100 |
Median |
300 |
Mean |
786 |
3rd Quartile |
1,000 |
Maximum |
26,000 |
Figure 2.1 shows the distribution of driving frequencies for Age45+ vehicles, based on survey responses. The frequency values also indicate that they are driven infrequently, with most vehicles being started less than once per day and, most commonly, once a month. CARB staff used this information to estimate the number of vehicle starts per day for Age45+ vehicles, which is used in the calculations of start emissions.
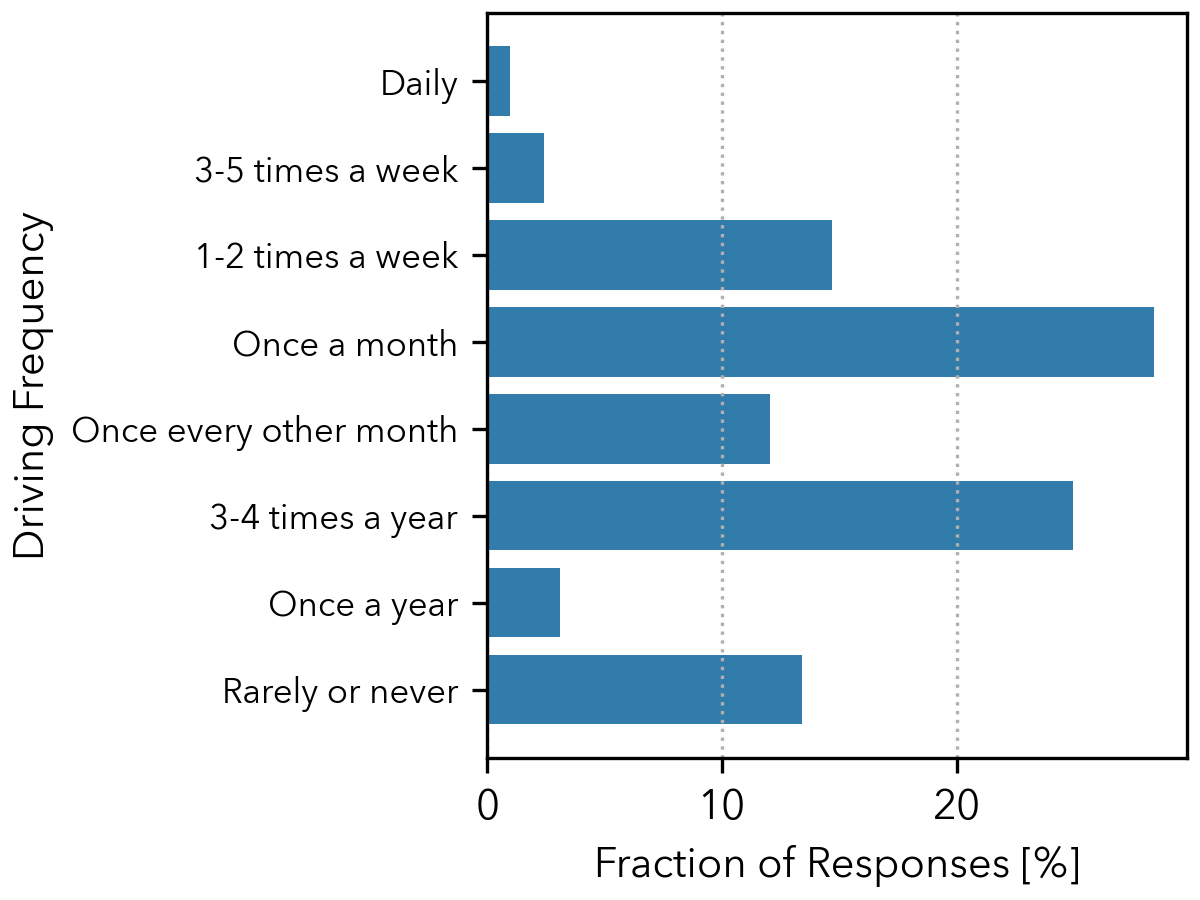
Figure 2.1: Driving Frequency for Age45+ Vehicles#
2.1.2.2. Vehicle Population#
The Age45+ vehicle population is estimated using DMV records for past years and regression-based estimates for future years. Historical population data for Age45+ vehicles were obtained from DMV records for 2001 to 2022. The Age45+ population includes all internal combustion vehicles (gasoline, diesel, and natural gas) from the DMV records. However, since more than 99% of these vehicles are gasoline, all Age45+ vehicles are assumed to be gasoline vehicles.
Based on the historical population, year-to-year retention rates were calculated for 2001 to 2022. Retention rate is defined as the proportion of vehicles from a given model year that remain registered and active in subsequent years. These retention rates were then used to estimate retention for the year 2000 and for future years starting in 2023. Figure 2.2 shows the retention rates of Age45+ vehicles from 2001 to 2022, along with the regression line for future years. Using the historical DMV data and retention rates derived from the regression fit for the future year, the Age45+ vehicle population for each year from 2000 to 2050 is estimated as shown in Figure 2.3. Note that retention rates remain above one until approximately 2030, indicating that the Age45+ vehicle population is growing. Although the projected trajectory eventually drops below one, this will be revisited in future releases of the model, as retention rates may not decrease as linearly as currently predicted.
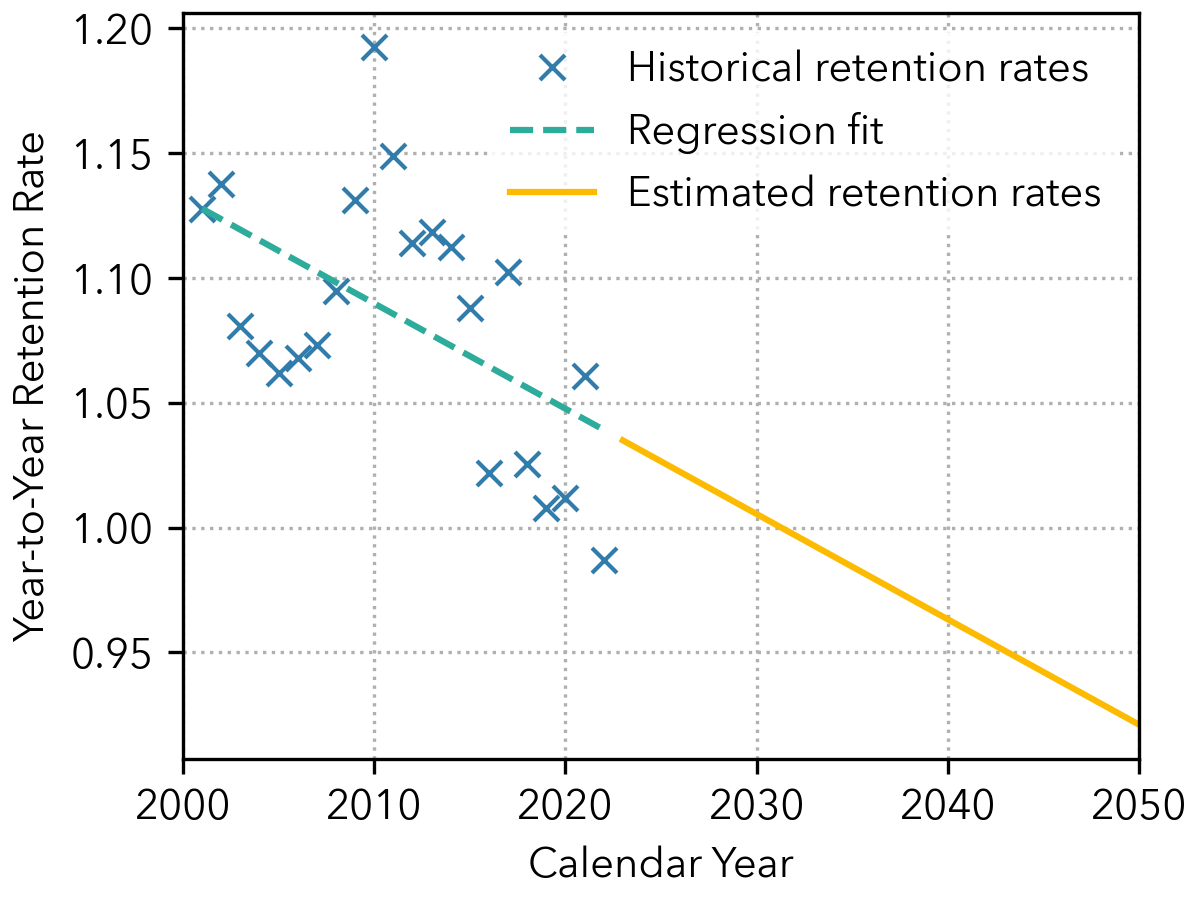
Figure 2.2: Retention Rates for Age45+ Vehicles. Data from 2001 to 2022 are based on DMV records. The orange line shows the regression fit, which is used to estimate retention rates for 2023 and later years.#
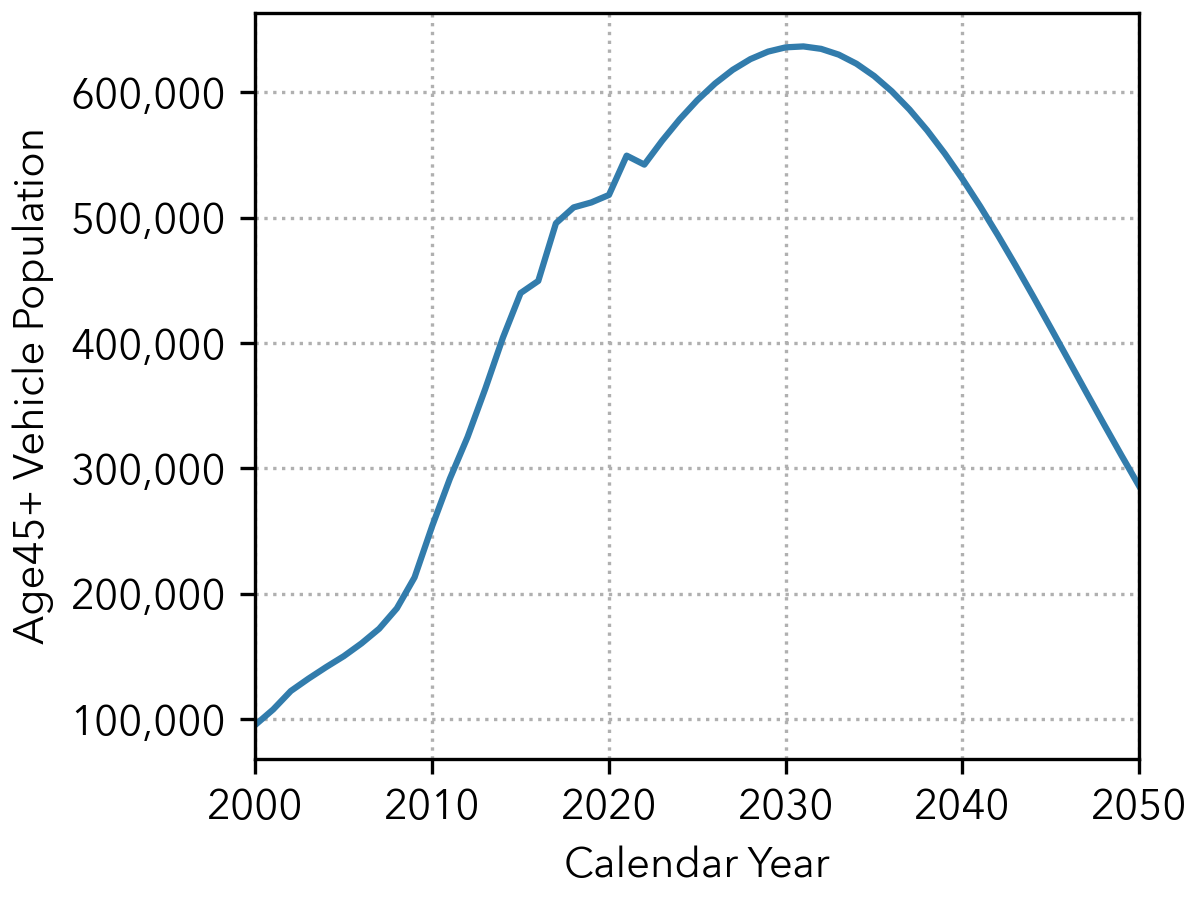
Figure 2.3: Age45+ Vehicle Population. Data from 2001 to 2022 are from DMV records; values for 2023 to 2050 are projections based on regression-derived retention rates.#
The estimated population of Age45+ vehicles is further divided by Geographic Area Index (GAI) and the four light-duty vehicle classes, using historical distributions from DMV data. The age distribution of Age45+ vehicles from DMV2022 is used to determine the age breakdown of the vehicle population, which is then used to calculate age-specific emission rates.
2.1.2.3. Vehicle Activity#
Estimating vehicle miles traveled (VMT) for Age45+ vehicles is essential for calculating running exhaust emissions. Figure 2.4 summarizes the annual mileage accrual rates of light-duty vehicles. The blue line indicates the average annual mileage accrual rates of passenger cars, and the dotted line shows a regression fit, both of which are used for LDA mileage accrual estimation in EMFAC2025. The yellow line represents data obtained from AAA Southern California, showing the annual mileage accrual rates for Age45+ vehicles among their insurance subscribers. The navy line indicates the annual mileage accrual rates for Age45+ vehicles based on the survey results. Based on these data, CARB staff determined to use the average annual mileage from the survey, which is 786 miles, as the annual mileage accrual rate for all Age45+ vehicles in EMFAC2025. This value is multiplied by the Age45 vehicle population to calculate total vehicle miles traveled (VMT).
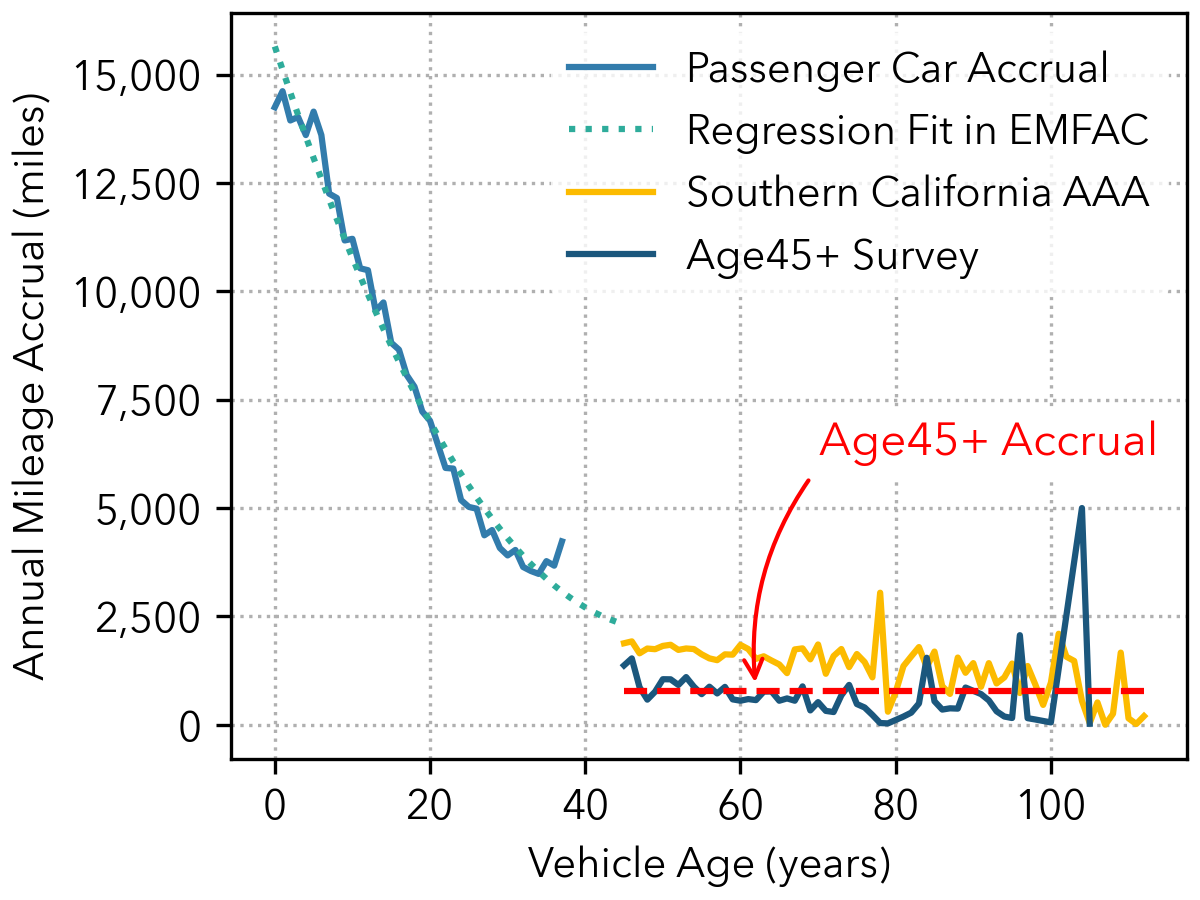
Figure 2.4: Accrual Rate Analysis for Age45+ Vehicles#
Based on the survey responses of driving frequency (see Figure 2.1), the average vehicle start frequency for Age45+ vehicles is estimated to be 0.14 starts per day. This value is used to calculate emissions from vehicle starts.
2.1.2.4. Emission Rates#
Emission rates for Age45+ vehicles are based on EMFAC baseline emission rates for each model year. These rates account for the effects of vehicle aging, deterioration, and vehicle technology groups. EMFAC applies these age-specific emission factors to the estimated population and activity data for Age45+ vehicles so that their emissions are accurately represented in inventory outputs.