3.5. Heavy-Duty Vehicle Miles Traveled Reallocation#
EMFAC estimates VMT at the sub-area level by combining population counts from registration data sources in a given sub-area and per-vehicle mileage accrual rates from the California Vehicle Inventory and Use Survey, which was last updated in EMFAC2021 (CARB, 2021). Additionally, accrual rates are adjusted for interstate fleet categories to account only for mileage within California.
Many truck fleet types operate significant distances from the sub-area in which they are registered. Therefore, the initial estimates for truck populations operating within a given sub-area are reallocated across all sub-areas within the State to reflect the latest information on truck operation. EMFAC historically relied on origin-destination survey data. Reallocation of out-of-state and IRP vehicles was based on a Caltrans study from 1999 (CARB, 2006), and other regional categories were based on a study from 2008 that was part of the Truck and Bus Regulation rulemaking (CARB, 2010). Staff updated truck populations, and therefore VMT, reallocation using a large volume of telematics data provided through an agreement with Geotab, along with Caltrans Annual Average Daily Traffic (AADT) data to validate the results.
The reallocation process for population and VMT starts with base year population data. The base year population data for 2022 serves as the input for the heavy-duty vehicles activity module to generate VMT. Figure 3.31 illustrates the process for calculating base year VMT and the process of incorporating high-resolution Geotab telematics data (shown in the red box), which modifies the distribution of population at the sub-area level. Initially, the population is adjusted using percentages derived from Geotab telematics data. This updated population is then input into the module to calculate the VMT at the sub-area resolution. The percentage of VMT per sub-area is checked to ensure it matches the initial percentages derived from the Geotab telematics data. If there is a difference, the reallocation process is repeated iteratively until the percentage of VMT per sub-area aligns with the Geotab telematics data. This iterative process is depicted in the loop within the flow chart. It is important to note that the total population of vehicles for each vehicle class in California remains constant, as this data is based on the most recent updates from the DMV.
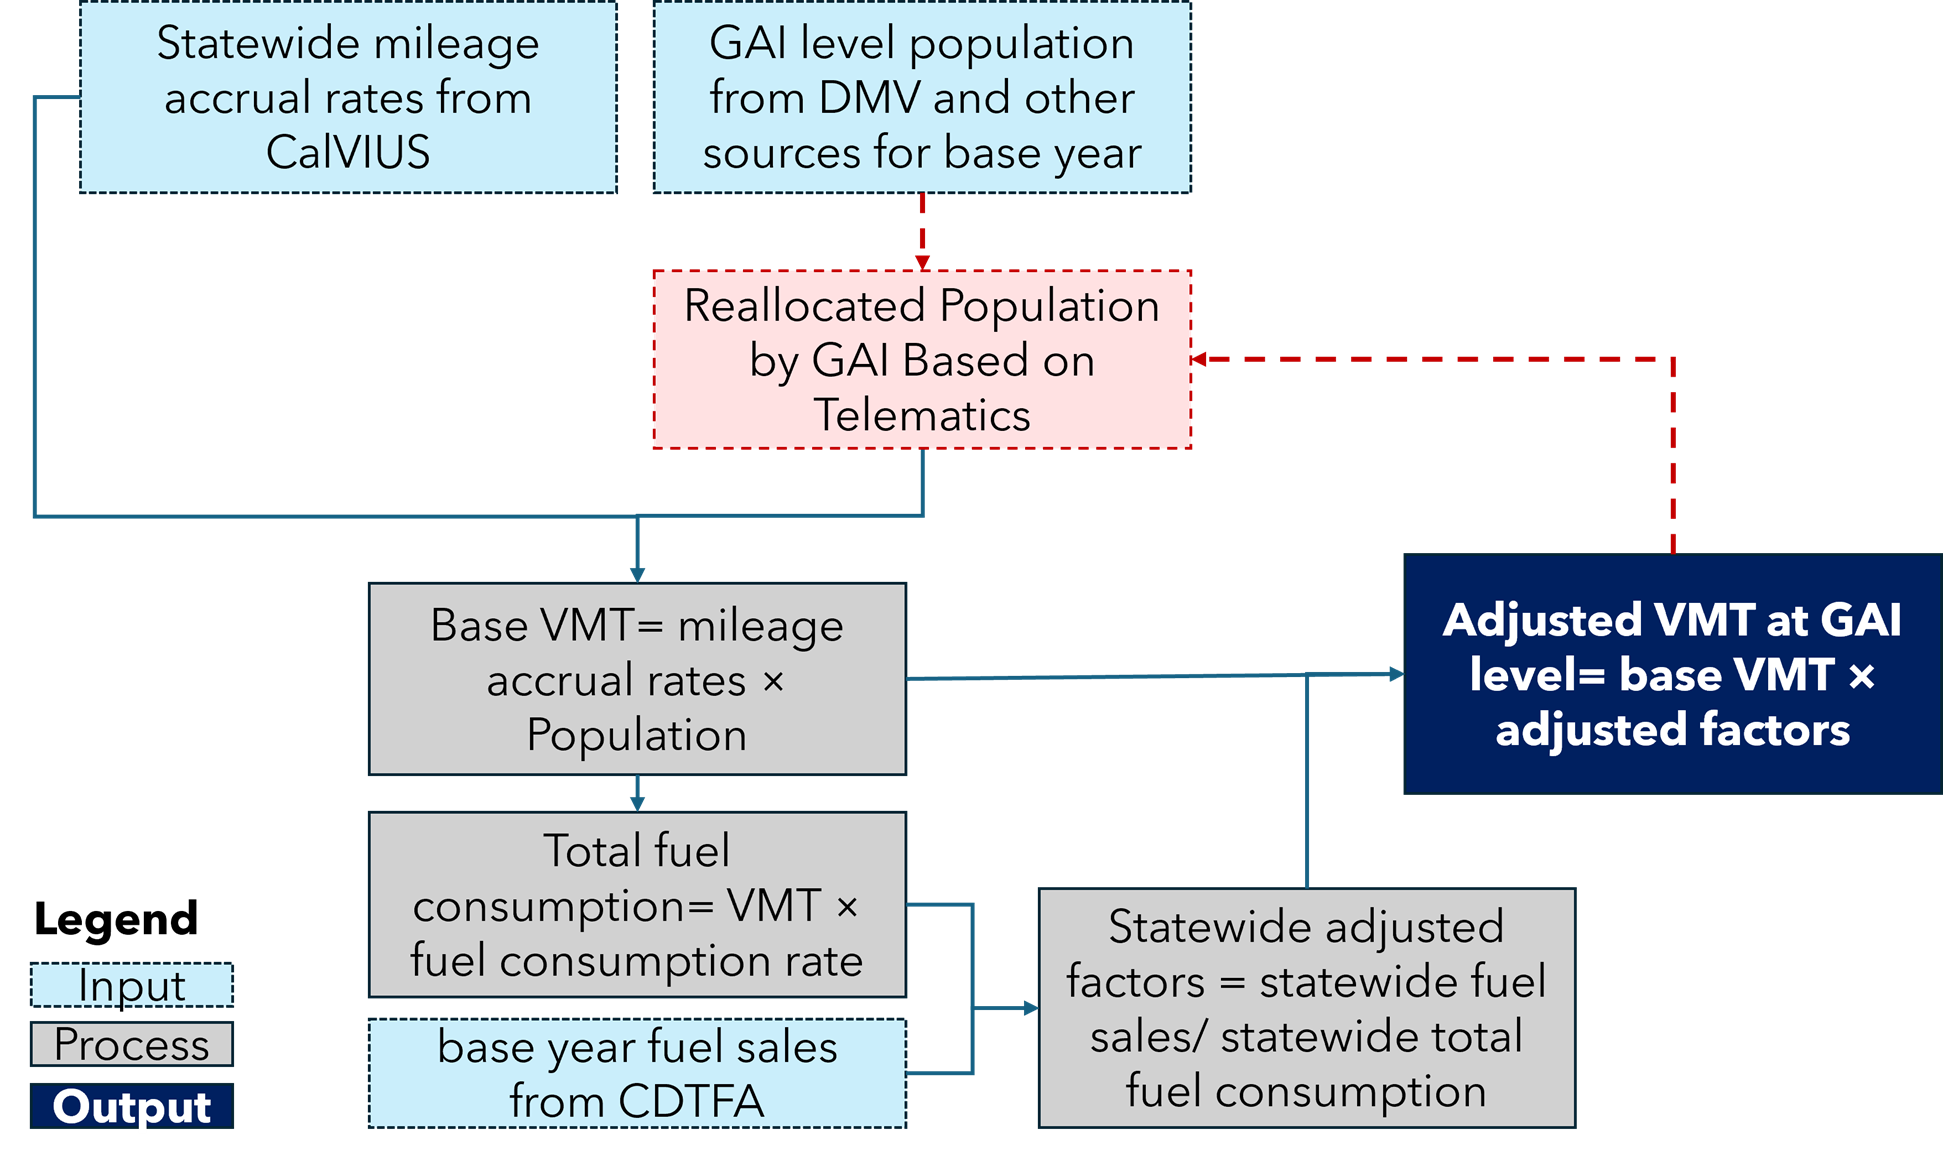
Figure 3.31: Process for Reallocation Heavy-Duty VMT in EMFAC2025#
While Geotab provides a representative subset of the general commercial population, it is 100% sampled VMT. Geotab provides a set of expansion factors as multipliers that, when applied to the sampled counts, estimate the general VMT. Geotab uses nationwide FHWA counting stations to create expansion factors for traffic volume using a concrete statistical model. For this update, staff complemented Geotab expansion factors with Caltrans AADT counting stations for two reasons: First, Caltrans AADT has more counting stations than FHWA (about 3,500 vs. 350 locations); second, Caltrans constantly monitors and updates the traffic volume at these locations.
After validating and updating the VMT data, staff used the revised distribution of population and VMT per sub-area to update the model input file for the base year population. Using the updated base year population and VMT, staff then forecasted and backcasted population and VMT for both future and historical years.
For historical years, staff started with the population data from 2008, the year when the last survey for VMT reallocation was conducted. The original population for 2008 served as the starting point, and the reallocated population data for 2022 was the endpoint. Using linear interpolation, staff calculated the population for each intermediate year by assuming a constant annual growth rate. This approach provided a continuous population series from 2008 to 2022. After establishing the interpolated population data, staff calculated the annual population growth rate for each vehicle class by determining the year-over-year percentage change in population from 2008 to 2022. Staff then applied these growth rates to adjust the population of specific vehicle classes, ensuring that the growth trends were accurately reflected.
Figure 3.32 compares heavy-duty VMT between EMFAC2025 and EMFAC2021 for sub-areas with the highest VMT. Compared to EMFAC2021, the updated VMT fractions in EMFAC2025 have the most significant relative decreases in Los Angeles (SC), Kern (SJV), and San Bernardino (MD), while Riverside (SC), San Joaquin Valley (SJV), and Sacramento (SV) have the most significant relative increases.
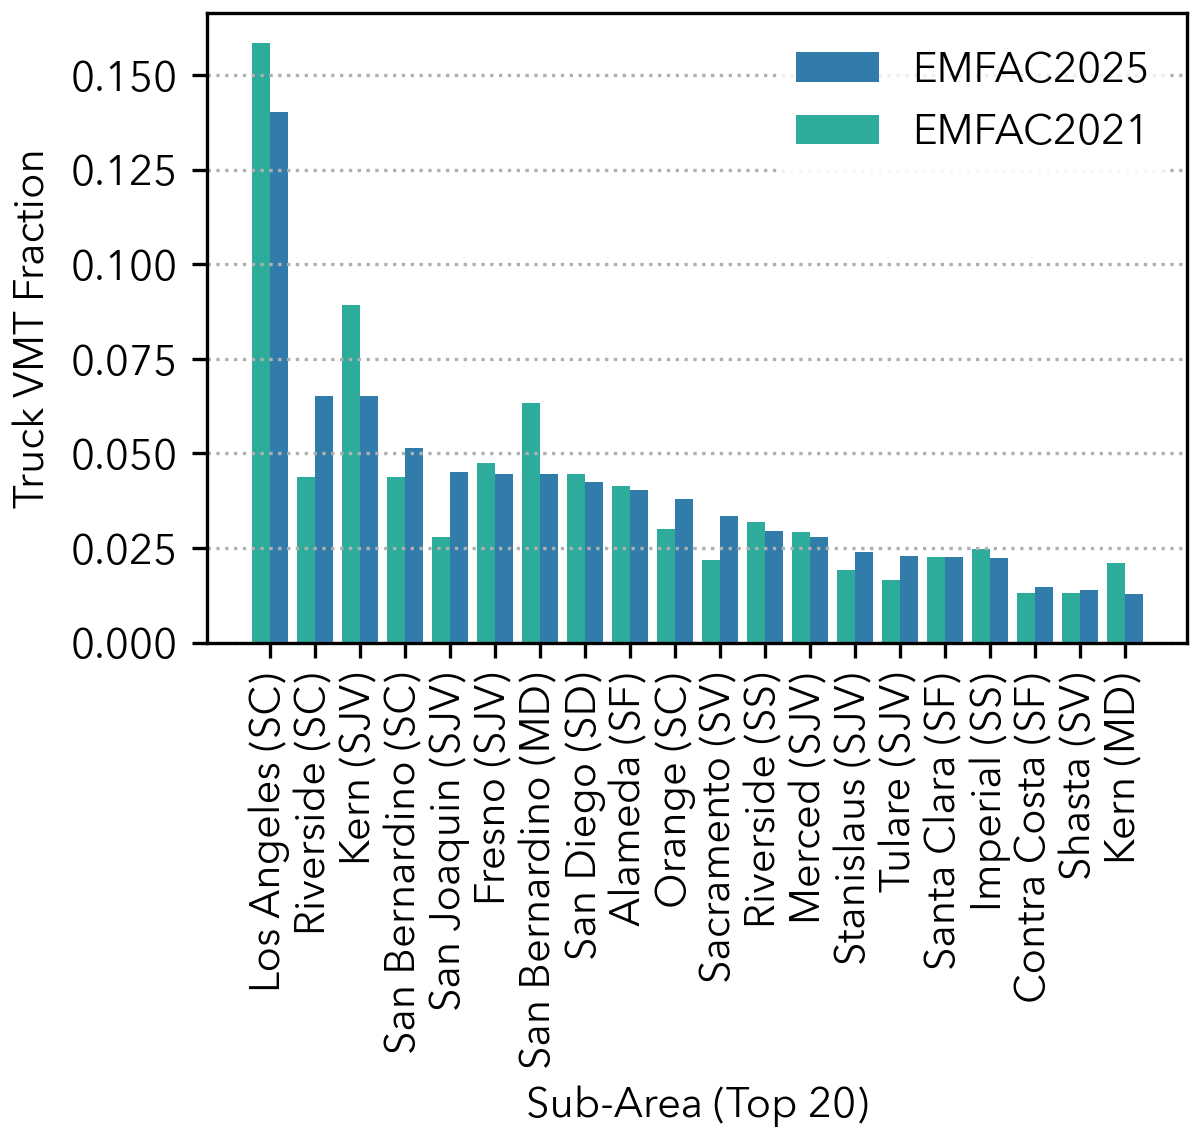
Figure 3.32: Heavy-Duty VMT Fractions in 20 Sub-Areas with Highest VMT#