2.2. High-Speed Driving#
2.2.1. Background#
The light-duty high-speed update to incorporate activity and emission factors is newly introduced in EMFAC2025. Previous EMFAC versions assumed no driving activity above 70 mph. The emission rate used at 70 mph was applied to any higher speed bin if the user input activity at speeds over 70 mph. The update discussed here addresses the speed bins from the 70 to 90 mph range.
There were two separate parts to the high-speed driving update. The first was an update to light-duty activity, specifically the light-duty speed distributions. The activity update is only relevant for the Default Activity mode of EMFAC2025. SIP and conformity analyses use Custom Activity modes (see Figure 1.1) to run EMFAC with MPO, rather than default, activity data. The second part of the update was to determine and implement high-speed SCFs to account for emissions at the higher speed bins. The latter update is relevant for both default mode runs as well as SIP and conformity analysis.
2.2.2. Light-Duty Vehicle Activity By Speed#
2.2.2.1. Data Sources and Analysis#
The national emissions inventory (NEI) dataset for California, obtained from U.S. EPA, was used to update the light-duty VMT speed distribution. This is a dataset based on StreetLight data collected during calendar year 2020. There were three primary processing steps that had to be performed on the NEI dataset to make it compatible with EMFAC2025. The first was to convert the time speed distributions to VMT speed distributions. The second was shifting the speed bin bounds of the NEI dataset to align with those used in EMFAC. And the third was to combine certain aspects of the NEI data that are at a more granular level than is needed for EMFAC.
In the first processing step, the NEI dataset speed distributions were converted from time fractions to VMT fractions. To convert to VMT, every speed bin’s time fraction in a distribution was multiplied by its speed bin midpoint. The resulting distribution initially has values that sum to much greater than 1, so a renormalization is required to obtain the final VMT distributions.
EMFAC uses upper-bound speed bins that all have a width of 5 mph, while NEI used midpoint-labeled speed bins with a width of 5 mph (with one exception, the first speed bin that has a width of 2.5 mph). This means the second EMFAC speed bin, labeled as the “10 mph” speed bin, includes VMT driven between 5 and 10 mph. However, the second NEI speed bin includes VMT driven from 2.5 to 7.5 mph. Because of this 2.5 mph offset, the NEI speed bins cannot be directly compared to those of EMFAC. To correct this, every NEI 5 mph bin was split into half such that all bins had a 2.5 mph width. Pairs of 2.5 mph bins were then summed back together such that the resulting bounds of each speed bin aligned with the speed bin bounds of EMFAC. For example, the second NEI speed bin mentioned above was split into two bins that included 2.5–5 and 5–7.5 mph, the VMT fraction from the 5–7.5 bin was then recombined with the VMT fraction from the 7.5–10 mph bin, resulting in the NEI’s VMT fraction for the 5–10 mph range, which then fully aligns with a corresponding EMFAC speed bin.
The third processing step with NEI data involved aggregating some of its data. The original dataset included VMT distributions (not absolute VMT) for each county, hour of day, month of year, source type, road type, and weekend/weekday. Because the EMFAC model is intended to represent a general weekday, only data for weekday distributions and the source type of passenger cars were used. However, multiple distributions for different road types had to be averaged together since EMFAC does not handle VMT on different road types. CARB staff used the default outputs of U.S. EPA’s MOtor Vehicle Emission Simulator (MOVES) to determine county-specific road-type VMT distributions within California and aggregated the road types together.
Finally, because the dataset was from calendar year 2020, which was highly anomalous due to the COVID-19 pandemic, only months from January and February were averaged together, and data from March to December were excluded. Though January–February data do not fully represent annual conditions, they are the most reliable months available from 2020. We will update the model as more complete and more recent datasets become available.
The maximum speed bin in the NEI dataset was 75 mph, but that speed bin included the fraction of all miles driven at speeds above that speed bin as well. The UC Davis Dataset (CARB contract 12-319) was used to bin the 75 mph speed bin out into separate higher speed bins. Based on the 200+ internal combustion engine (ICE) vehicles logged in the UC Davis study, the magnitude of the three additional higher-speed bins, at 80, 85, and 90 mph, was determined (relative to the 75 mph speed bin), and applied to all speed distributions in the NEI dataset.
2.2.2.2. Light-Duty Vehicle Activity Results#
Figure 2.5 compares the final statewide light-duty combustion VMT (cVMT) distributions used in EMFAC2025 and EMFAC2021. EMFAC2025 has a larger fraction of speeds driven both at lower (\(<\)25 mph) and at higher (\(>\)70 mph) speeds, relative to EMFAC2021. Because fuel consumption and emissions tend to be worse at either lower or higher speeds, this update impacts emissions of several pollutants. However, the impacts are not straightforward due to the fuel matching applied in EMFAC. Because this update shifts cVMT to speeds where fuel efficiency is lower, and the overall cVMT in the model is constrained by total fuel sales in California, the end result is that this activity update decreases the total cVMT estimated by EMFAC2025.
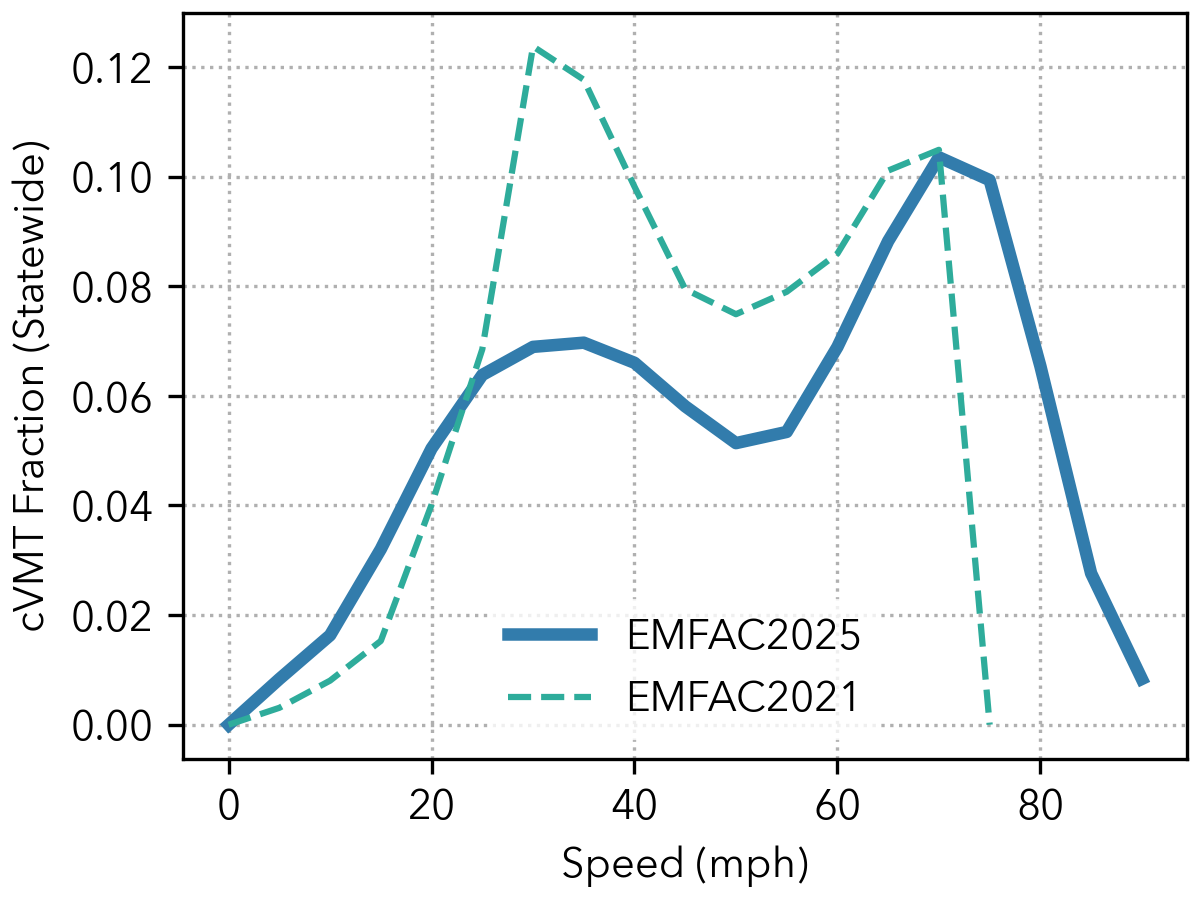
Figure 2.5: Statewide Speed Distribution of Combustion Vehicle Miles Traveled (cVMT)#
2.2.3. Speed Correction Factors (SCF)#
A test plan was developed to test vehicles at high speeds, as CARB’s light-duty surveillance program does not conduct testing at high speeds. The highest speed cycle used in the light-duty surveillance program is Freeway Cycle (FC) 7, averaging 73 mph. From a few recent studies, it is revealed that FC7 does not represent the real-world maximum speed in California. Moreover, recent data collected from light-duty passenger vehicles in a study conducted by UC Davis highlights that 19.6% of vehicle miles traveled (VMT) is driven at speeds 70 mph or faster (Tal et al., 2020). This data was collected from GPS and telematics from the vehicles.
The high-speed test plan was developed using a few test cycles which include the Unified Cycle (UC), the Federal Test Procedure (FTP), and FC5 to FC7. Furthermore, new cycles, FC8, 9, and 10 were developed based off of FC7. Table 2.4 illustrates the various cycles involved in the high-speed test plan.
Test Cycles |
Mean Speed (mph) |
|---|---|
Federal Test Procedure |
21.2 |
Unified Cycle |
22.9 |
Freeway Cycle 5 |
56.5 |
Freeway Cycle 6 |
65.2 |
Freeway Cycle 7 |
72.9 |
Freeway Cycle 8 |
83 |
Freeway Cycle 9 |
93 |
Freeway Cycle 10 |
103 |
2.2.3.1. Data Collection#
Test vehicles included passenger cars, SUVs, and trucks with model years ranging from 2015–2023 with Gross Vehicle Weight Ratings (GVWR) up to 10,000 lbs. Table 2.5 lists the vehicles, technology groups, and the mileages of the vehicles tested.
No. |
Vehicle |
Technology Group |
Mileage (miles) |
|---|---|---|---|
1 |
2022 Nissan Altima |
SULEV30 |
36,994 |
2 |
2023 Chevy Camaro |
ULEV50 |
28,652 |
3 |
2022 Honda Civic |
SULEV30 |
49,428 |
4 |
2023 Nissan Maxima |
ULEV125 |
11,921 |
5 |
2023 Toyota 4Runner |
ULEV70 |
11,679 |
6 |
2015 Toyota Corolla |
ULEV125 |
115,948 |
7 |
2016 Ford F150 |
ULEV125 |
51,688 |
8 |
2015 Honda Accord |
SULEV30 |
105,337 |
9 |
2015 Toyota Camry |
LEVII ULEV |
93,357 |
10 |
2015 Honda Civic |
LEVII SULEV |
76,271 |
The emissions gathered in these tests included HC, NOx, CO, and CO2. First, each pollutant is normalized by the UC Bag 2 data for each vehicle. The normalized data is then averaged for each cycle for all vehicles. Following that, the normalized mean is then graphed for a regression analysis to reveal a trendline formula, the formula used to calculate the SCF for each speed bin.
After determining the formula, the speed bins are used as inputs with the range for high-speed testing being from 70 to 90 mph. The resulting data represents the SCFs which go up to 103 mph in the testing conducted. However, currently EMFAC VMT fractions only go up to 90 mph.
2.2.3.2. Speed Correction Factor Results#
2.2.3.2.1. HC High-Speed Speed Correction Factors#
In Figure 2.6, the analysis of the 10 tested vehicles shows the HC emissions for the mean speed of each test cycle.
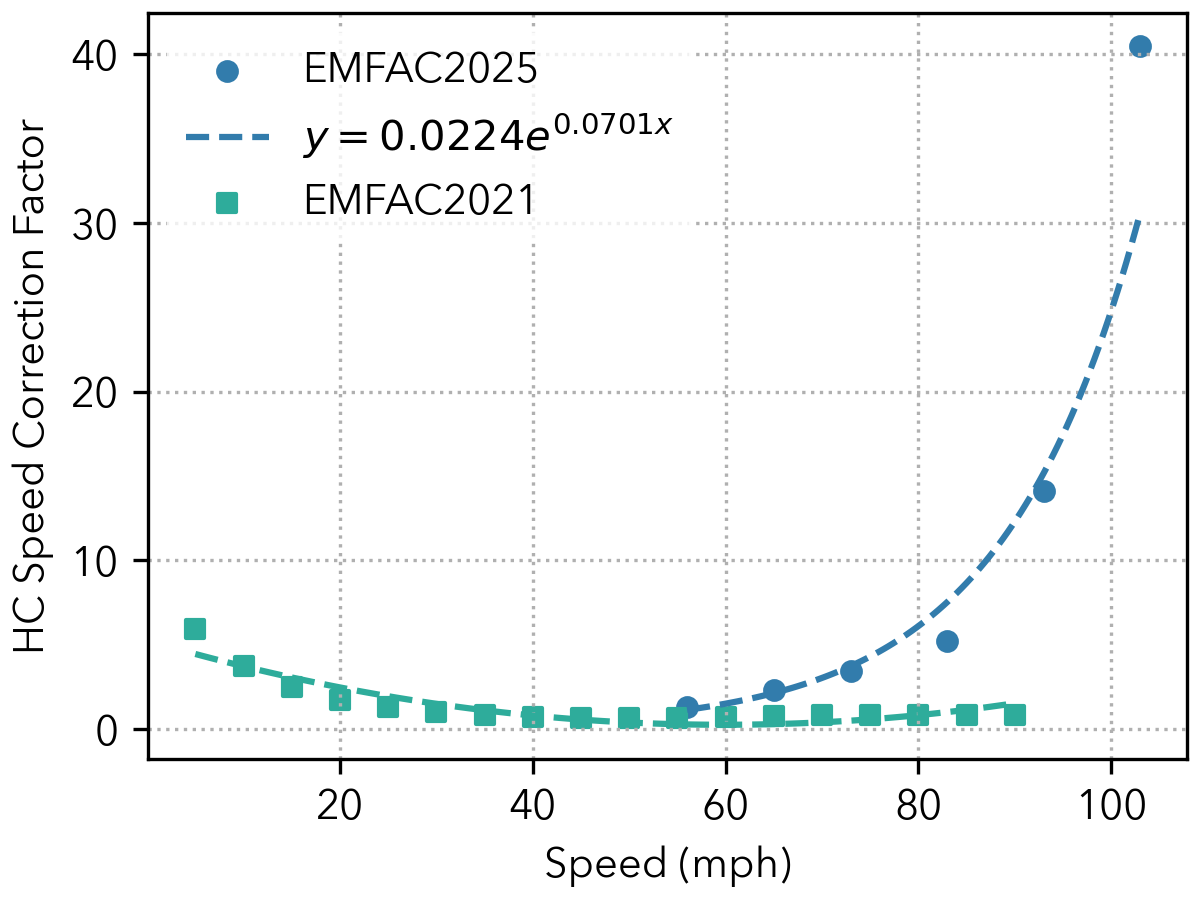
Figure 2.6: High-Speed Emission Rate Regression Fit Derived for HC#
This chart shows normalized and mean emissions of HC from EMFAC2021 (green line) and the updates that went into EMFAC2025 (blue line). CARB staff can see the change in emissions reflected by the vehicles tested from the high-speed test plan. The best fit equation was calculated through the data and was determined to be the exponential equation as indicated as Equation (2.1).
Using Equation (2.1) above, the SCFs were calculated and are shown in Table 2.6 by speed bins for speed bins of 70 to 90 mph. It is important to note that the values for each speed bin for all pollutants are calculated with the midpoint speed of the bin, that is 67.5 mph for the 70 mph speed bin, and so on for the rest of the bins.
Speed Bin |
Mid-Point Speed (mph) |
HC SCF |
|---|---|---|
70 |
67.5 |
2.54 |
75 |
72.5 |
3.61 |
80 |
77.5 |
5.12 |
85 |
82.5 |
7.27 |
90 |
87.5 |
10.3 |
As mentioned above, the emissions are normalized to the mean emissions of UC Bag 2 and their results are shown as speed correction factors in Table 2.6 and plotted in Figure 2.7 by speed bin. Table 2.6 and subsequent SCF tables apply as scalars to the base emission rate. For example, the 70 mph value (2.54) is multiplied by the emission rate at 27 mph. The range of the speed bins in the figure is extended to 100 mph although the EMFAC2025 SCFs are applied only up to 90 mph. The same analysis method conducted for HC is carried forward for the remaining pollutants of NOx, CO, and CO2.
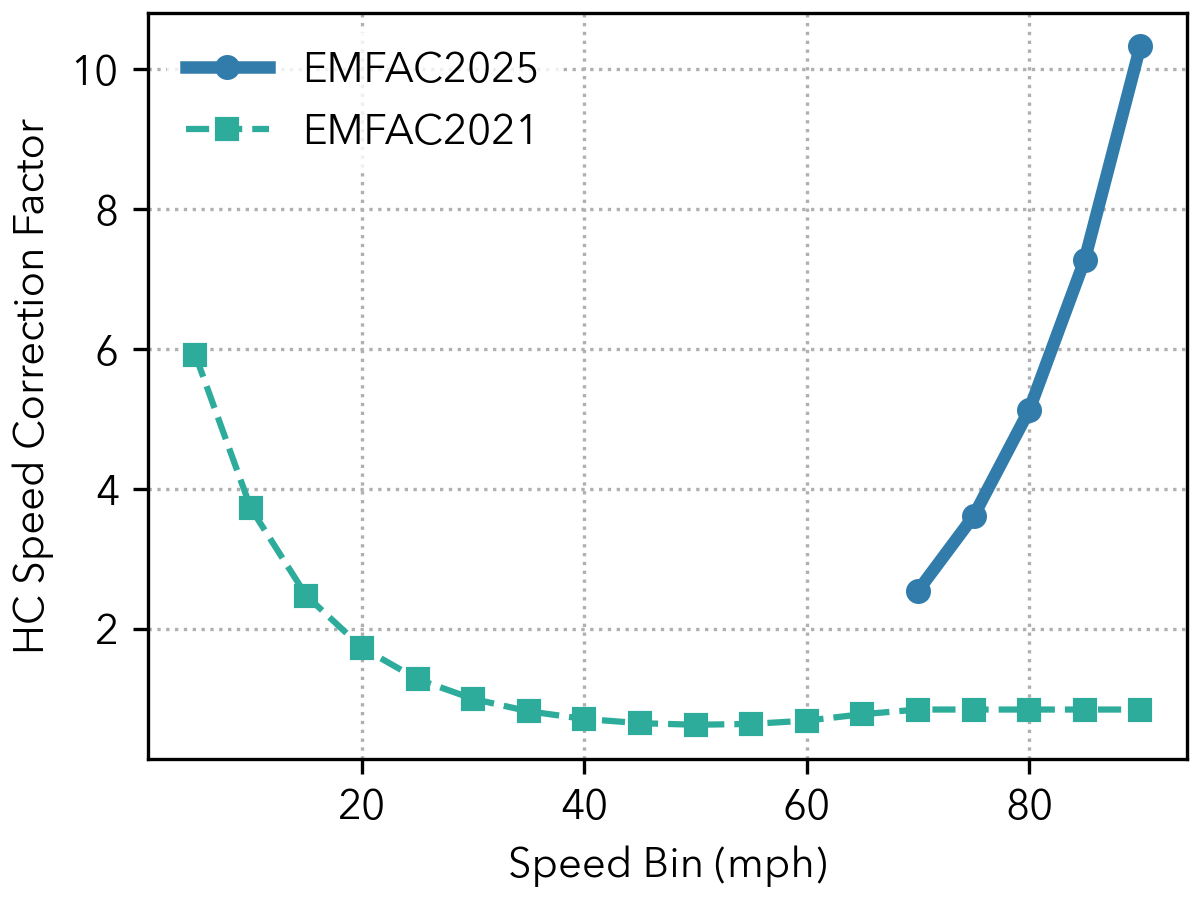
Figure 2.7: HC Speed Correction Factors#
2.2.3.2.2. NOx High-Speed Speed Correction Factors#
In Figure 2.8, the analysis of the 10 tested vehicles shows the normalized mean NOx emissions for the average speed corresponding to each FC.
Similar to HC, this chart shows normalized mean emissions of NOx from EMFAC2021 (green) and the updates that went into EMFAC2025 (blue). The best fit equation derived from the regression analysis reveals a second order polynomial as indicated in Equation (2.2).
Using the equation above, the SCFs were calculated and are shown in Table 2.7 by speed bins for speed bins from 70 to 90 mph.
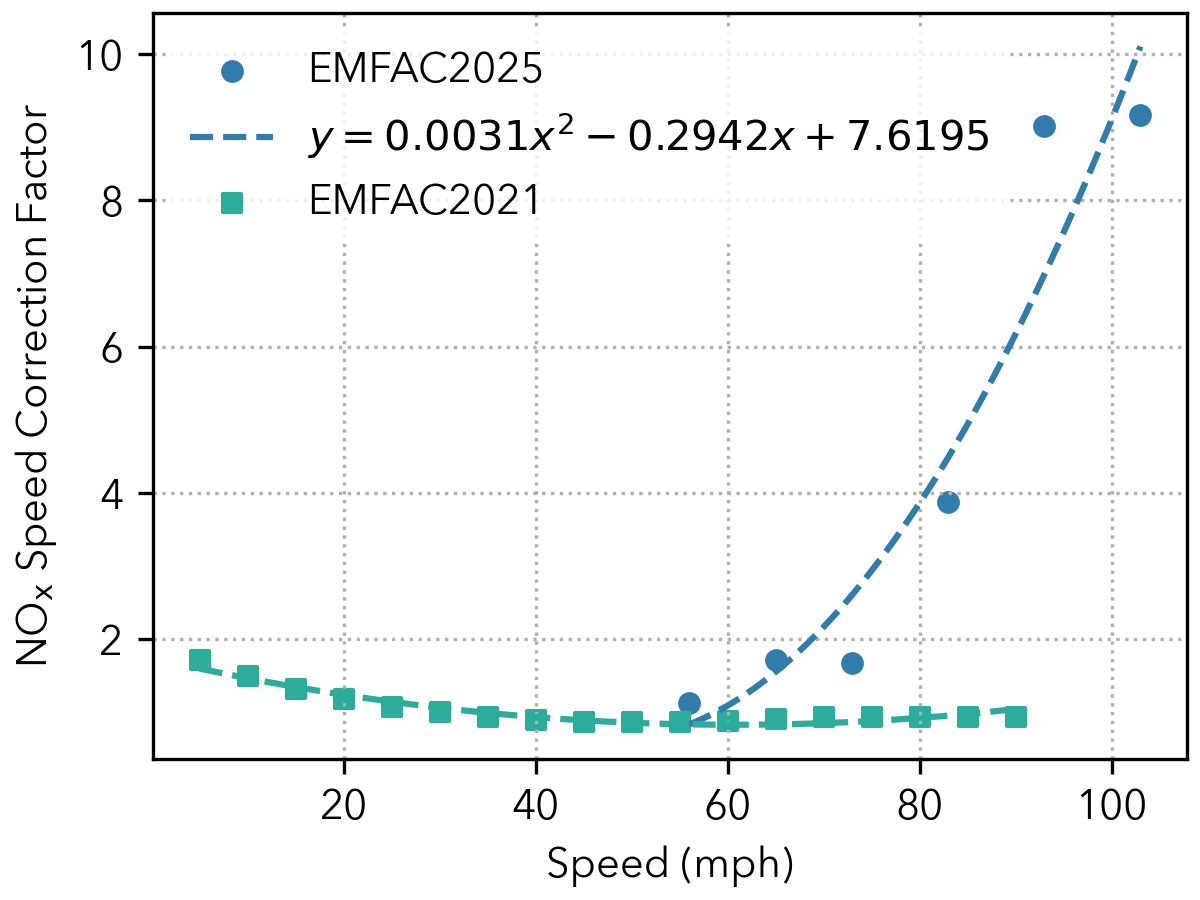
Figure 2.8: High-Speed Emission Rate Regression Fit Derived for NOx#
Speed Bin |
Mid-Point Speed (mph) |
NOx SCFs |
|---|---|---|
70 |
67.5 |
1.84 |
75 |
72.5 |
2.53 |
80 |
77.5 |
3.38 |
85 |
82.5 |
4.38 |
90 |
87.5 |
5.54 |
In Figure 2.9, the NOx SCFs are shown. Similar to the HC SCFs, the graphs are normalized to 27 mph, the average speed of UC Bag 2. For EMFAC2025 the graph illustrates that emission rates increase with increasing speed.
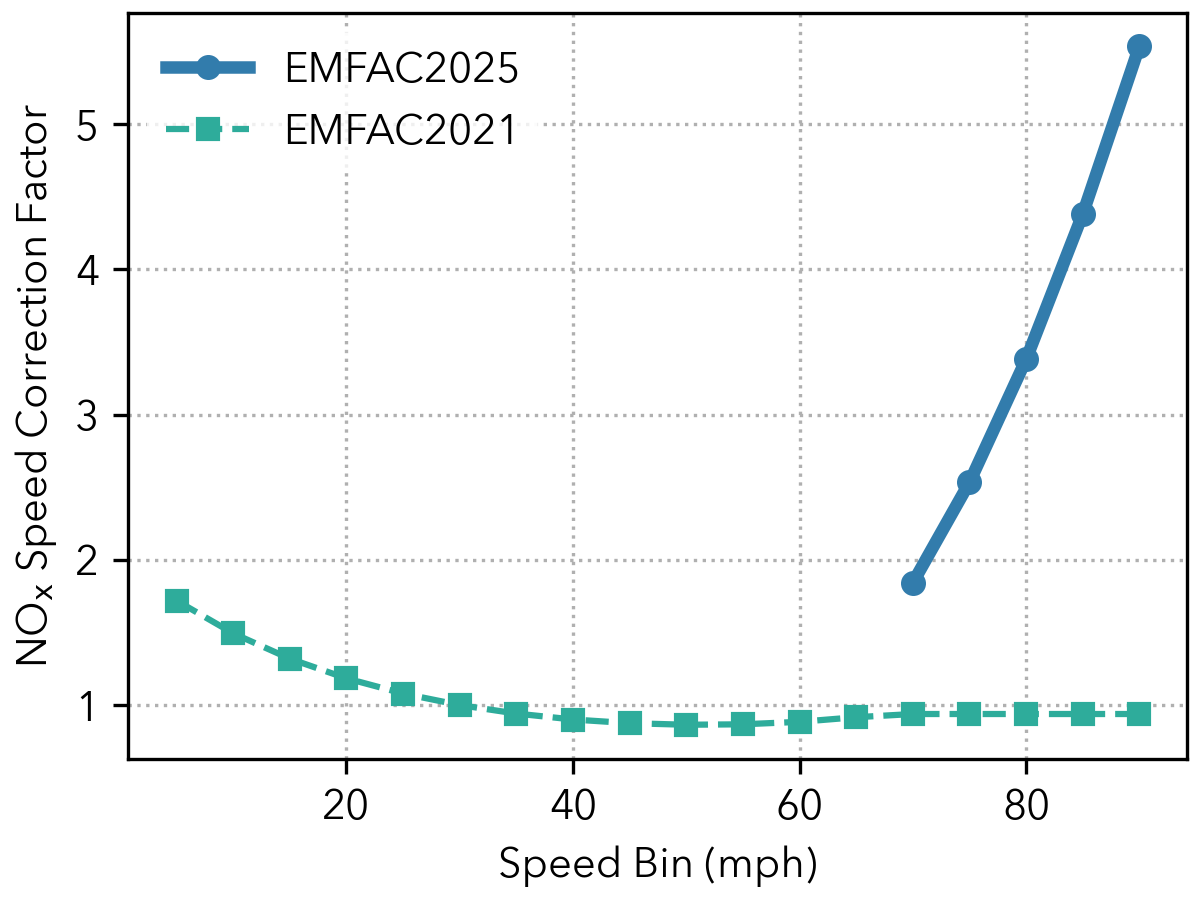
Figure 2.9: NOx Speed Correction Factors#
2.2.3.2.3. CO High-Speed Speed Correction Factors#
In Figure 2.10, the analysis of the 10 tested vehicles shows the normalized mean CO emissions for the average speed corresponding to each FC.
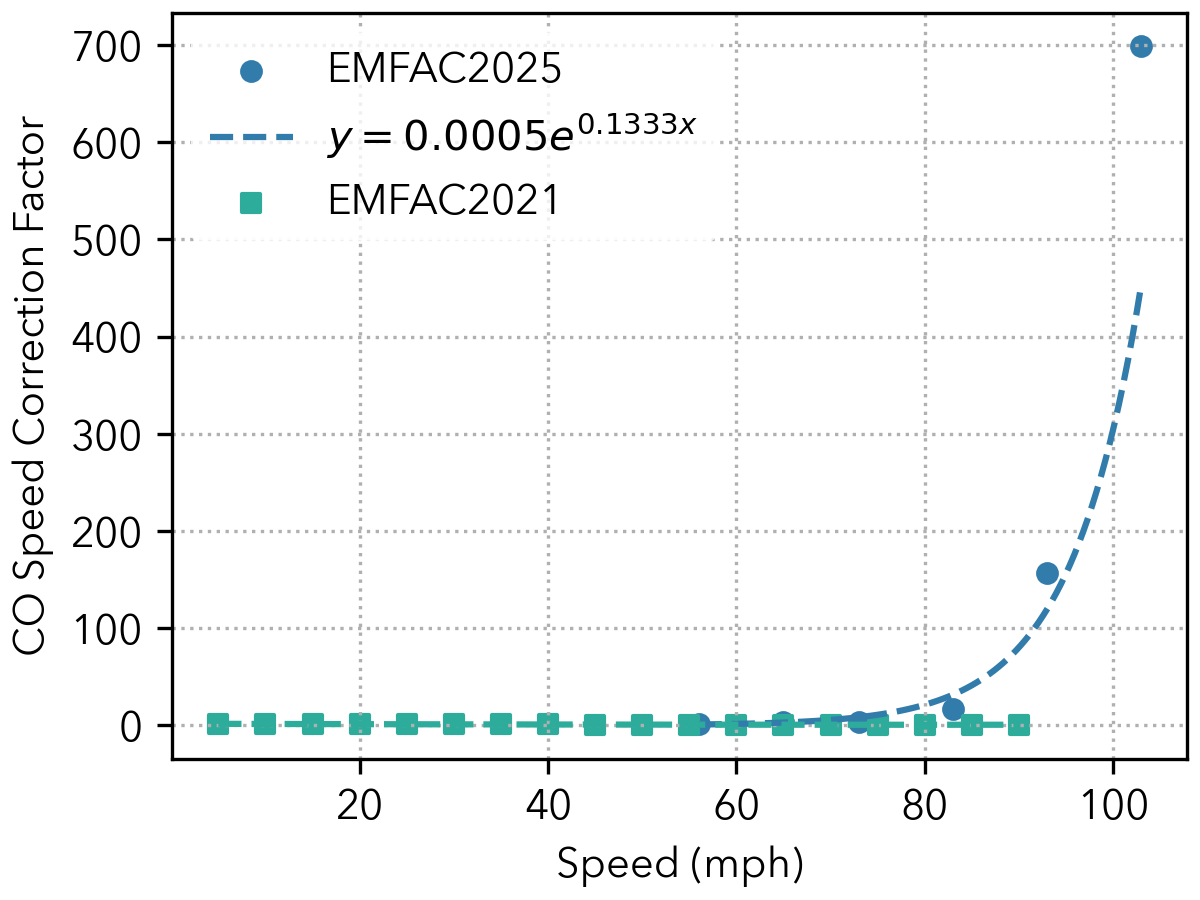
Figure 2.10: High-Speed Emission Rate Regression Fit Derived for CO#
This chart shows emissions of CO from EMFAC2021 (green line) and the updates that went into EMFAC2025 (blue line). The SCFs for CO follow an exponential fit as indicated in Equation (2.3).
Using the equation above, the emissions were calculated and are shown in Table 2.8 by speed bins for speed bins of 70 to 90 mph.
Speed Bin |
Mid-Point Speed (mph) |
CO SCFs |
|---|---|---|
70 |
67.5 |
3.99 |
75 |
72.5 |
7.78 |
80 |
77.5 |
15.2 |
85 |
82.5 |
29.5 |
90 |
87.5 |
57.5 |
In Figure 2.11, the CO SCFs are shown. Again, similar to the HC and NOx SCFs, the graphs are normalized to 27 mph, the average speed of UC Bag 2. As illustrated by the graph, when the speed bin increases, the emission rates increase.
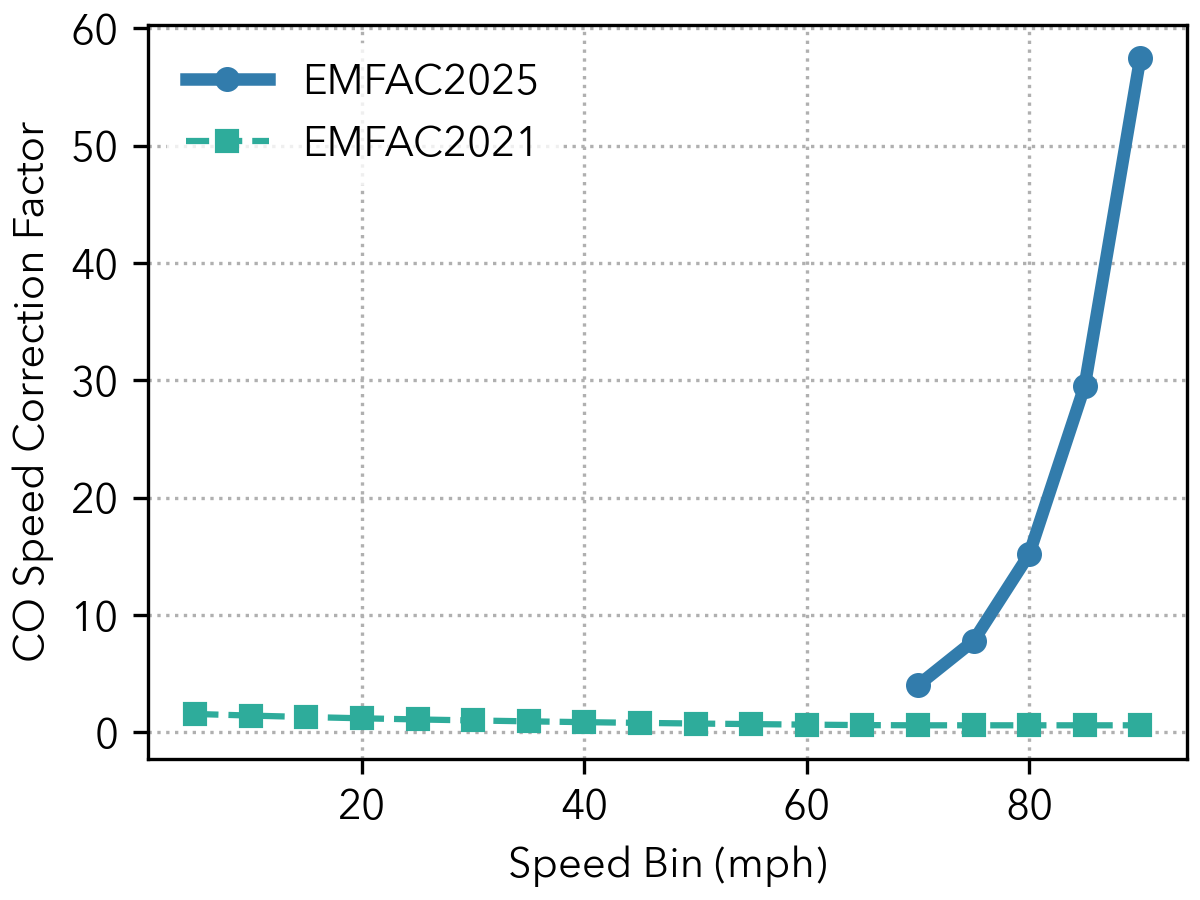
Figure 2.11: CO Speed Correction Factors#
2.2.3.2.4. CO2 High-Speed Speed Correction Factors#
In Figure 2.12, the CO2 SCFs are shown. Again, similar to the HC, NOx and CO SCFs, the graphs are normalized to 27 mph, the average speed of UC Bag 2. As illustrated by the graph, emission rates increase with increasing speed.
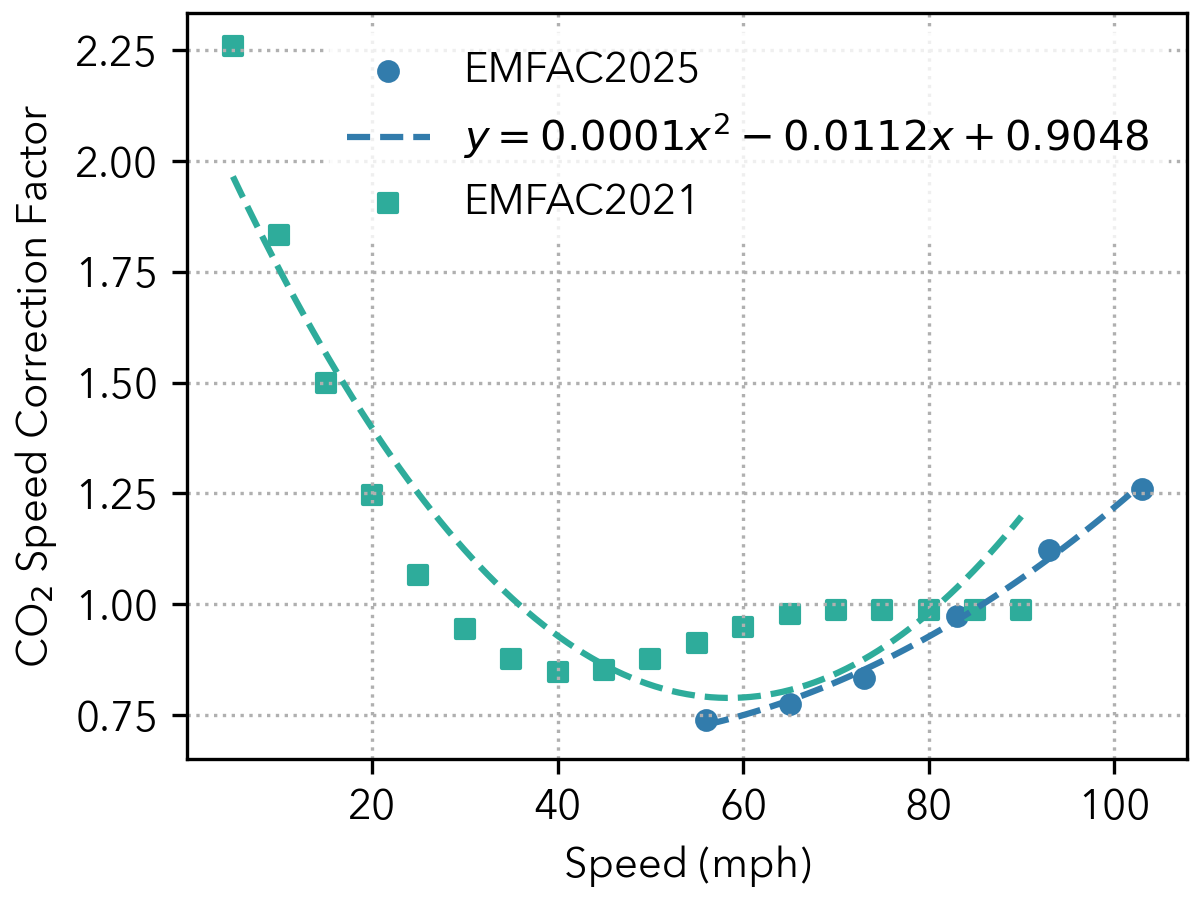
Figure 2.12: High-Speed Emission Rate Regression Fit Derived for CO2#
In all the previously listed pollutants, CARB staff normalized the data so that at 27 mph the SCF equaled 1. The SCFs for CO2 follow a second order polynomial fit, indicated as Equation (2.4). For CO2, however, CARB staff further scaled the EMFAC2025 (blue line) data such that its 65 mph speed bin equaled the value of the EMFAC2021 (green line) 65 mph speed bin.
Using the equation above, the emissions were calculated and are shown in Table 2.9 by speed bins for speed bins of 70 to 90 mph.
Speed Bin |
Mid-Point Speed (mph) |
CO2 SCF |
|---|---|---|
70 |
67.5 |
1.03 |
75 |
72.5 |
1.09 |
80 |
77.5 |
1.16 |
85 |
82.5 |
1.23 |
90 |
87.5 |
1.32 |
In Figure 2.13, the updated CO2 SCFs are graphed.
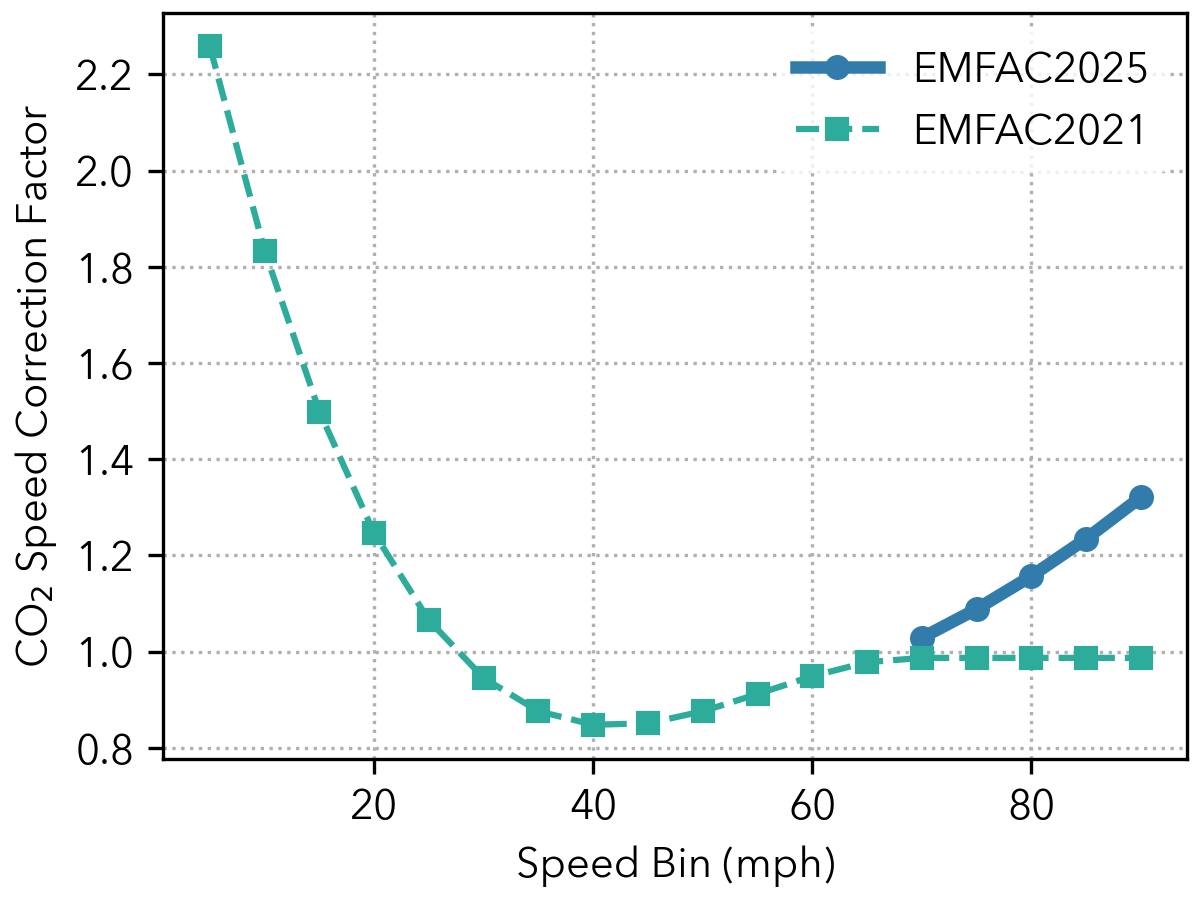
Figure 2.13: CO2 Speed Correction Factors#
2.2.4. Conclusion#
The activity update was applied to a set of vehicle categories, while the SCF update was applied to specific technology groups. The activity update applies to LD groups up to GVWR 8500 lbs (LDA, LDT1, LDT2, MDV, and MCY) and broadly impacts all model years, past and future, in EMFAC2025. The technology groups impacted by the SCF update include ULEVII, SULEV30, SULEV20, ULEV50, and ULEV70, which collectively span 2004–2040 model years. For every other technology group, there is no high-speed SCF adjustment made. The emissions testing for the high-speed test plan is ongoing and as such the emission rates will continue to be refined for future versions of EMFAC.
The SCF update (excluding the activity update) will impact only 1 speed bin at 65–70 mph (midpoint 67.5 mph) because it is the first and lowest speed bin to have an updated SCF, but the highest speed bin with MPO activity. The impact of this one speed bin in the SCF update is a 15% increase of ROG and a 6% increase of NOx from light-duty vehicles (including all LD tech groups, ages, and categories). These are the effects expected to be observed in SIP and transportation conformity analysis, since they use MPO speed distributions and not the NEI activity update discussed above.
The result of both the activity and SCF updates, as reflected in EMFAC2025 default mode runs, is a 3% increase of ROG and a 5% increase in NOx for light-duty vehicles. It is initially counterintuitive that the addition of the high-speed activity up to 90 mph, on top of the SCF update, lessens the emissions impact relative to those from the SCF update alone. However, this is expected for some pollutants. Total fuel use in EMFAC2025 is constrained by fuel sales data obtained from the California Department of Tax and Fee Administration (CDTFA). When this activity update included driving at higher speeds where fuel efficiency is worse, while constraining the total fuel use, the net effect is a reduction of cVMT. In other words, this activity update caused EMFAC2025 to use its fixed quantity of fuel to travel faster (thereby emitting more per mile), but for a shorter distance. This reduction of cVMT from the activity update causes some pollutants in default mode runs to have smaller emissions increases than SIP and conformity runs with EMFAC2025 (which use MPO activity data), relative to EMFAC2021.