3.1. Light-Duty Fleet Characterization#
This section describes the major updates to light-duty fleet characterization and details changes to the methodology, tools, and data sources used to characterize the vehicle population in California. It also compares fleet vehicle counts as modeled by EMFAC2025 and EMFAC2021. EMFAC2021 incorporated DMV data up to 2019, while EMFAC2025 added three additional years, using actual registration data through 2022. In the comparisons presented in this chapter, EMFAC2025 reflects DMV-based counts for calendar year 2022, whereas EMFAC2021 relies on forecasted counts for 2020 and onward.
3.1.1. Method#
Starting in January 2018, DMV began sharing quarterly cuts of vehicle registration data with CARB. The data cuts, containing approximately 53 million records and 100 data fields, are available in January, April, July, and October of each calendar year. EMFAC2025 uses the October data cut of year 2022 as the main source of data for fleet characterization but incorporates vehicle registration status from the following April 2023 data cut to update any vehicles with pending registration.
The fleet characterization begins with loading the raw DMV data into a secured database, and then removing duplicate records to only keep the last record associated with each vehicle identification number (VIN). All newly acquired VINs are run through VINtelligence, a tool developed by S&P Global Mobility that verifies and decodes vehicle information using a VIN, to obtain details that may be missing from DMV records (such as gross vehicle weight code, model year, make name, series name, model name, body style, motive power, fuel type, displacement, battery size, etc.). Only on-road vehicles registered in the October database are analyzed and assigned a vehicle classification. Vehicles are classified based on manufacturer certification Executive Orders (EO) issued for each vehicle make, model, and model year. Finally, each record is distributed to a geographic area index (GAI) based on the registered owner address and used in the population numbers for EMFAC.
3.1.2. Vehicle Population#
Figure 3.1 compares gasoline LDA vehicle populations in EMFAC2025 and EMFAC2021. As shown, EMFAC2025 projects a faster decline in vehicle populations, showing a 6.3% decrease from 2020 to 2022 compared to the previous model.
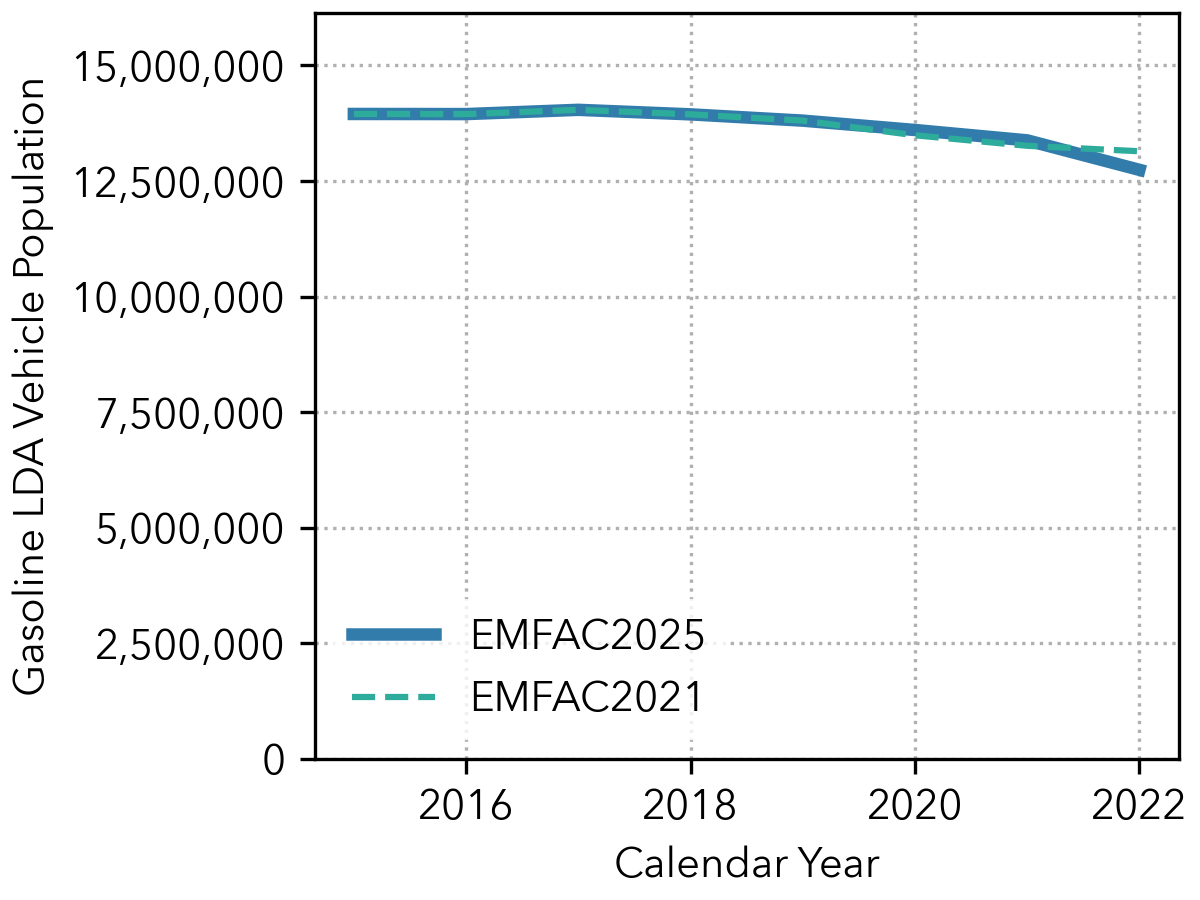
Figure 3.1: Gasoline LDA Population: EMFAC2025 vs. EMFAC2021#
Figure 3.2 shows that the population counts for gasoline light-duty trucks (LDT), which include the EMFAC vehicle categories LDT1, LDT2, and MDV, are higher in EMFAC2025 than in EMFAC2021. In EMFAC2025, there is a pronounced increase in the LDT population between calendar years 2020 and 2021, followed by a slight decline in 2022. By 2022, the difference in LDT population estimates between EMFAC2025 and EMFAC2021 is relatively small, at less than 2%.
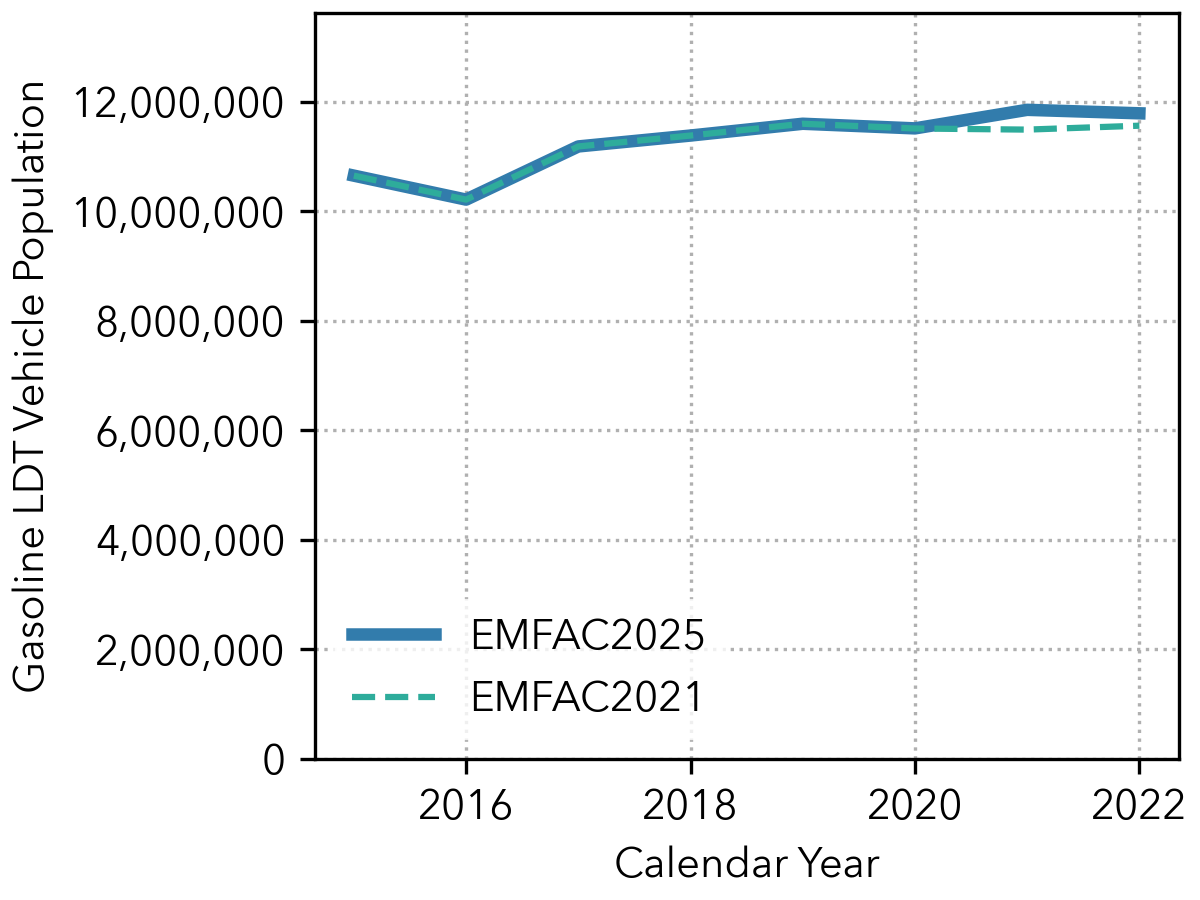
Figure 3.2: Gasoline LDT Population: EMFAC2025 vs. EMFAC2021#
Figure 3.3 shows the population of gasoline light heavy-duty trucks (LHDT), which includes LHD1 Public, LHD1 Other, LHD2 Public, and LHD2 Other. While EMFAC2021 forecasted a steady, gradual decline in LHD populations, actual DMV registration data used in EMFAC2025 shows an increase in population in calendar year 2020, followed by a slight decline over the subsequent two years. Notably, for calendar year 2022, the EMFAC2021 projection closely matches the actual DMV-based count in EMFAC2025.
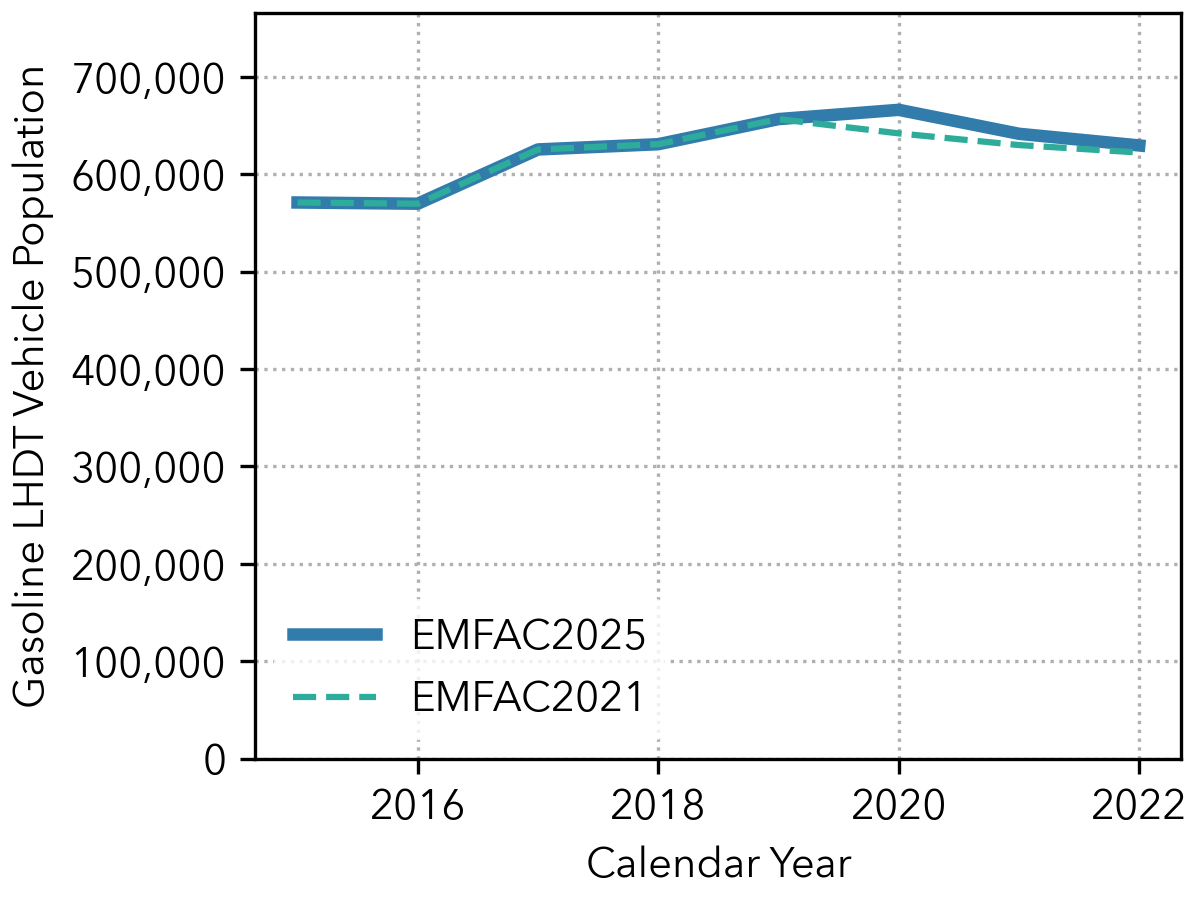
Figure 3.3: Gasoline LHDT Population: EMFAC2025 vs. EMFAC2021#
Figure 3.4 shows a sharp decline in the number of diesel LDA vehicles. Both EMFAC2025 and EMFAC2021 reflect similar trends from calendar years 2020 to 2022, indicating a continued decrease in the diesel vehicle population within this category.
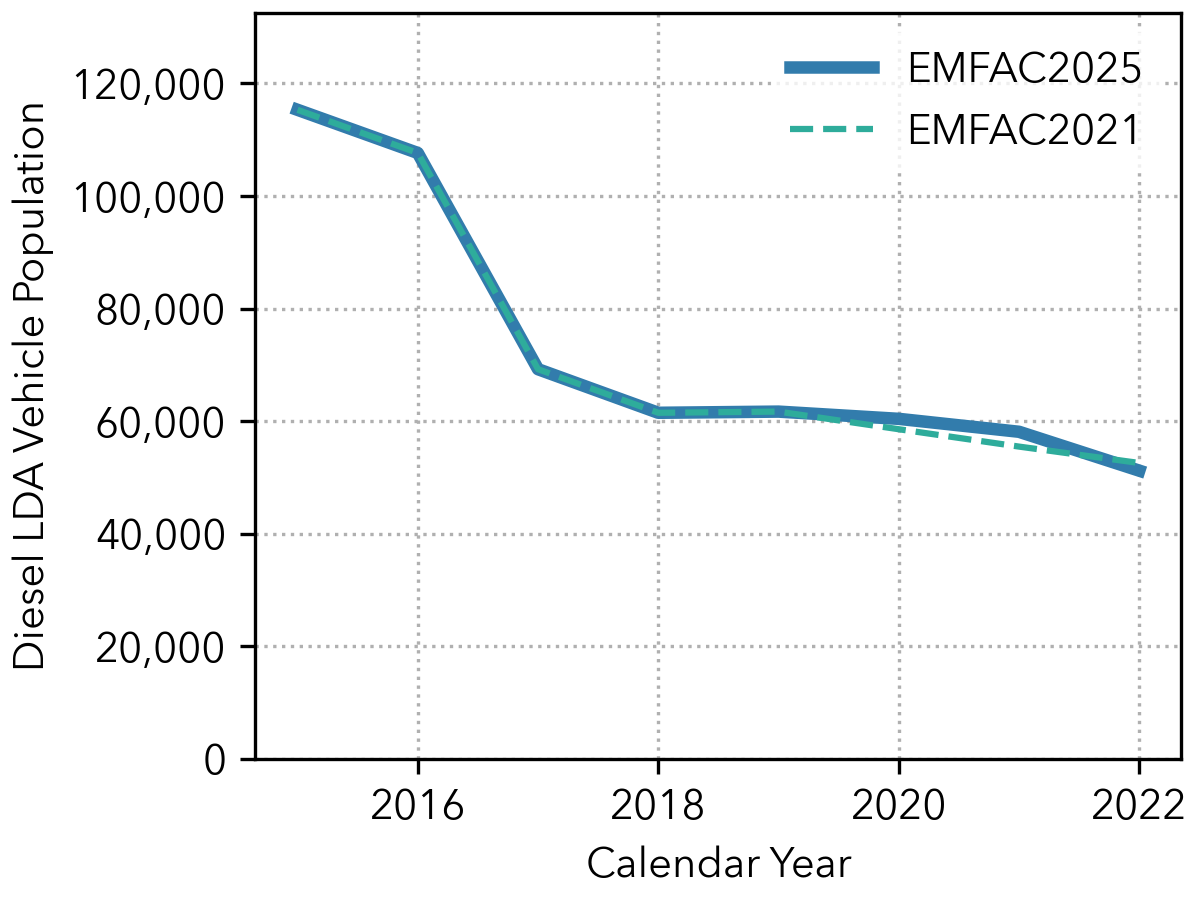
Figure 3.4: Diesel LDA Population: EMFAC2025 vs. EMFAC2021#
As shown in Figure 3.5, EMFAC2021 predicted steady growth in diesel LDT populations. In contrast, EMFAC2025 indicates a sharp decline in calendar year 2020, followed by significant growth in 2021 and 2022. The discrepancy between the two models indicates that the 2022 population was underpredicted by nearly 20%.
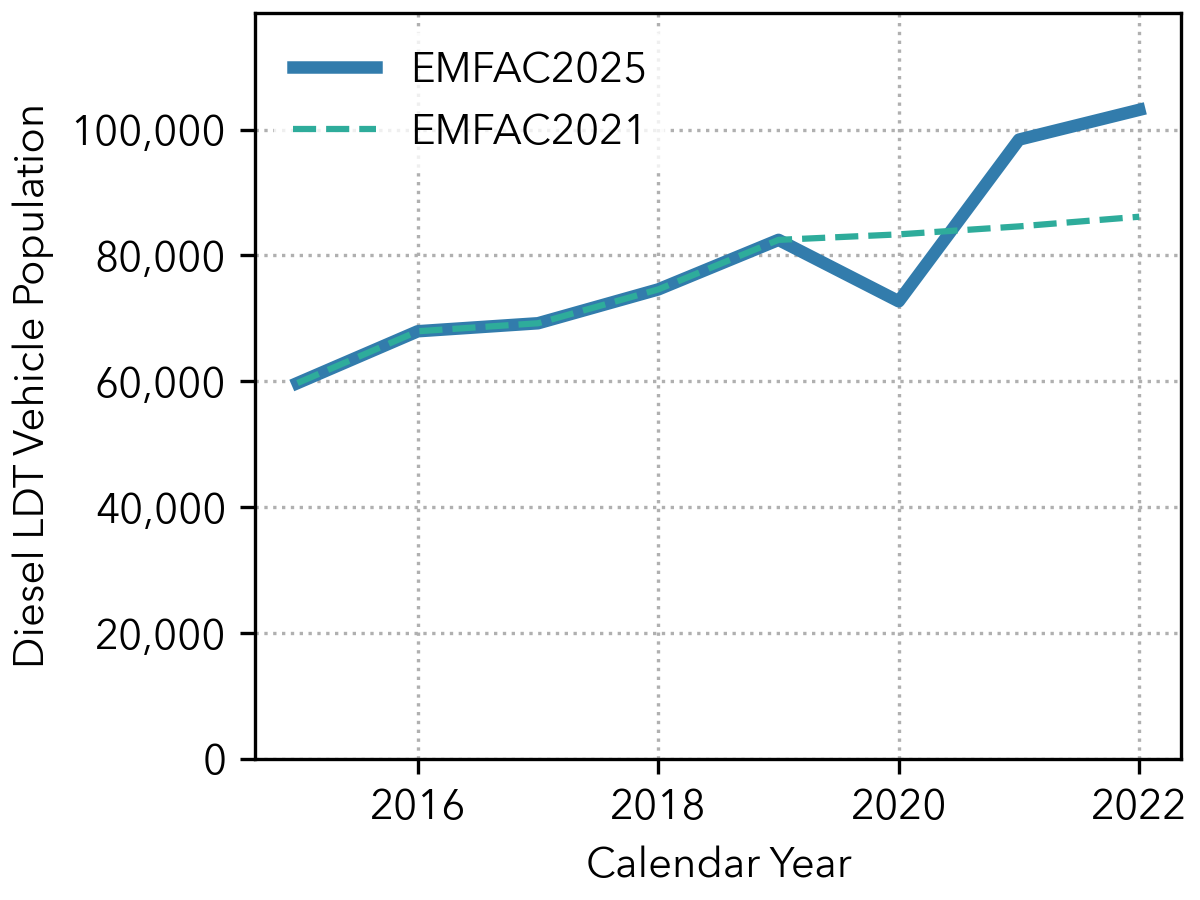
Figure 3.5: Diesel LDT Population: EMFAC2025 vs. EMFAC2021#
For diesel LHDT vehicles shown in Figure 3.6, there is close agreement between the estimated populations from EMFAC2021 and the DMV registration counts reflected in EMFAC2025. The EMFAC2025 populations have exceeded the forecasted EMFAC2021 populations for this vehicle category by a nominal 1.2%.
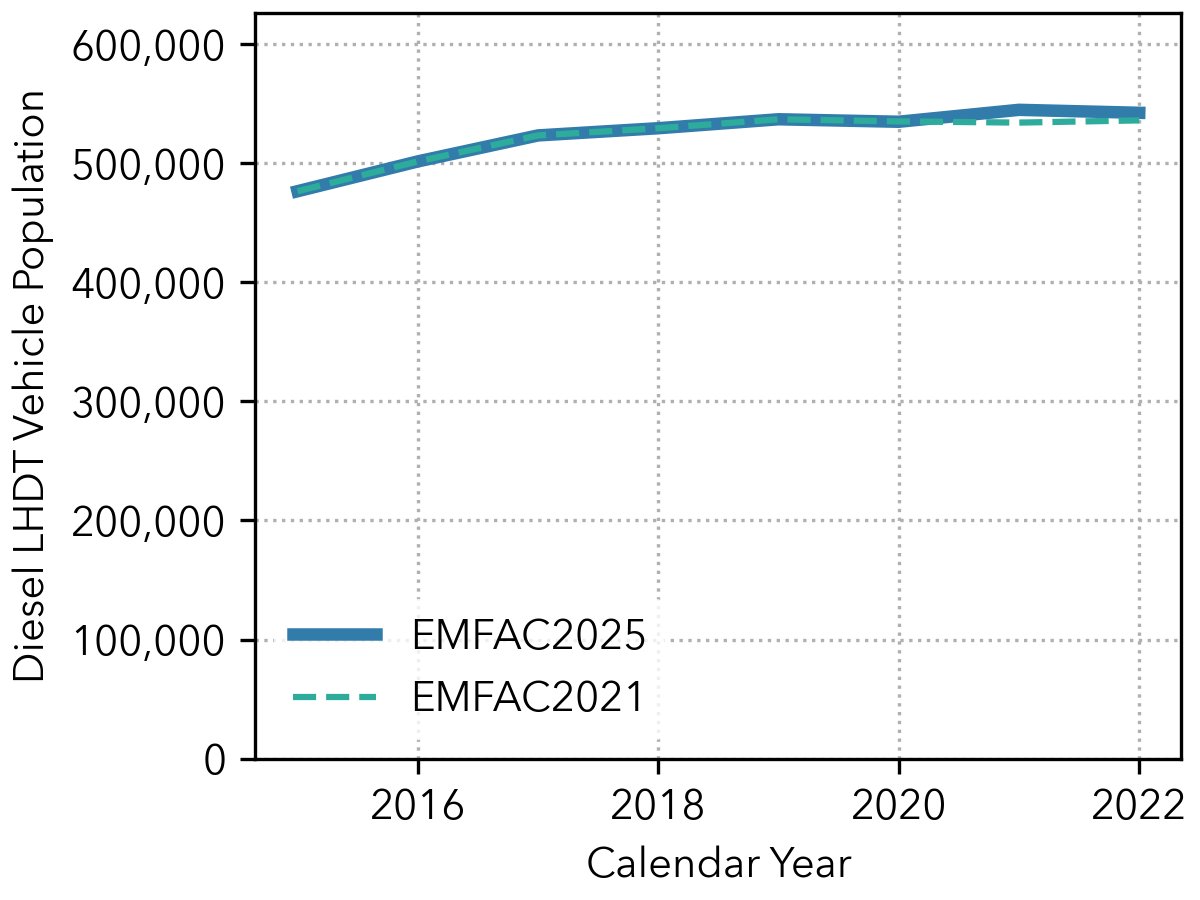
Figure 3.6: Diesel LHDT Population: EMFAC2025 vs. EMFAC2021#
Figure 3.7 illustrates that the EMFAC2025 electric LDA population is substantially higher than the forecast population of EMFAC2021. Due to the slower growth rate projected by EMFAC2021, the 2022 DMV population exceeds its forecast by 25%.
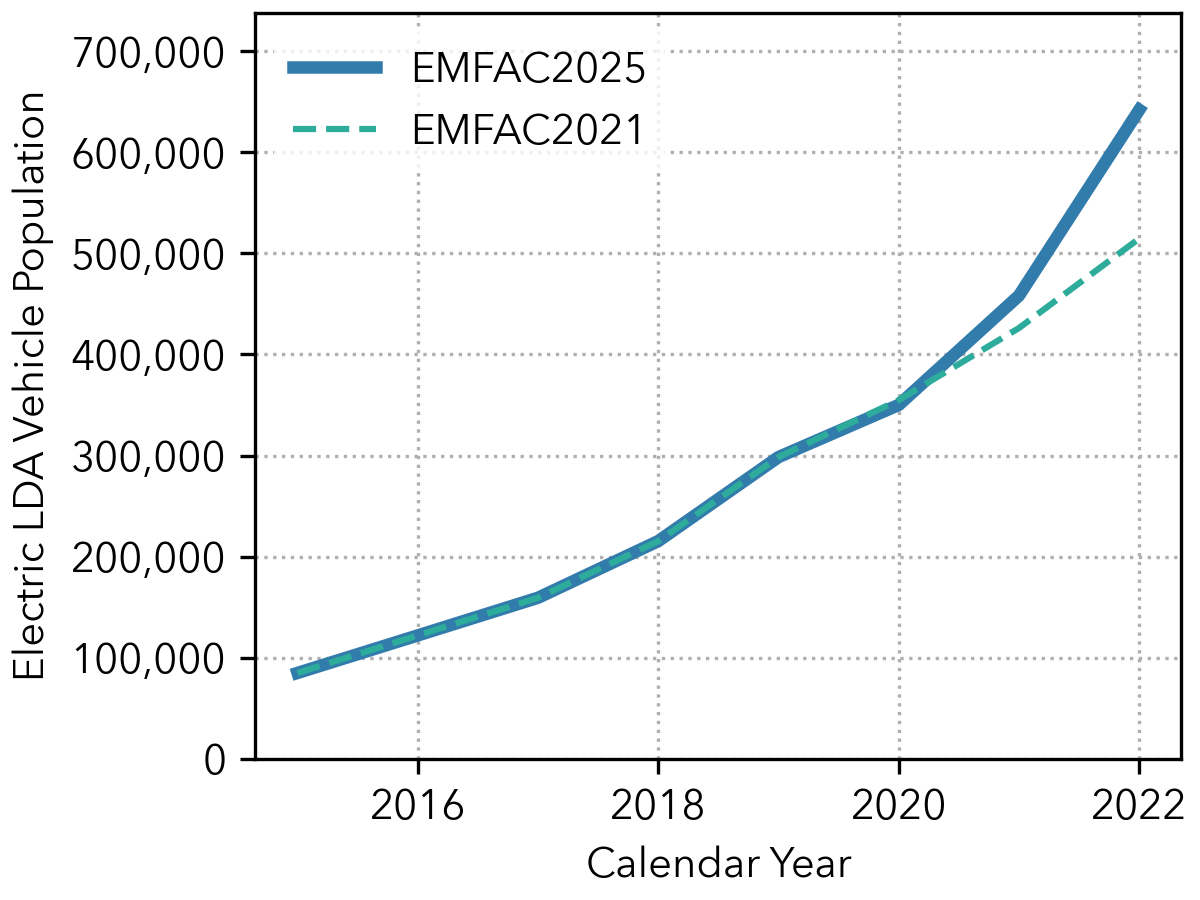
Figure 3.7: Electric LDA Population: EMFAC2025 vs. EMFAC2021#
According to Figure 3.8, electric LDTs have not experienced as rapid growth as their LDA counterparts. While electric LDT populations grow in EMFAC2025, the increase for these alternative fuel vehicles is slower than the rate predicted by EMFAC2021, with the actual DMV population being 23% lower than what was predicted for calendar year 2022.
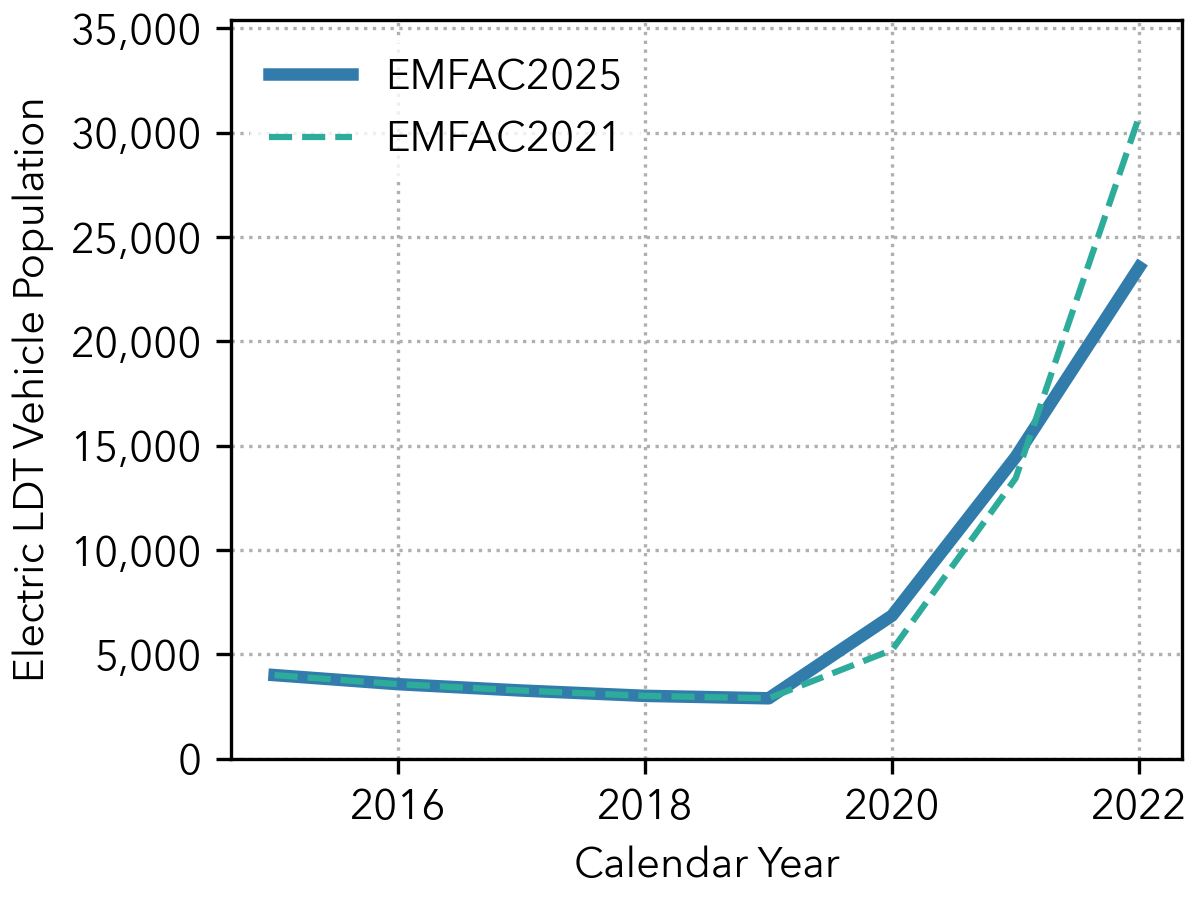
Figure 3.8: Electric LDT Population: EMFAC2025 vs. EMFAC2021#
3.1.3. New Vehicle Sales#
Figures 3.9 and 3.10 illustrate sales trends for new gasoline LDAs and LDTs sold in California. In EMFAC2021, the new sales projections for LDAs and LDTs showed similar trends from 2020 to 2022. This pattern of mirroring continues in EMFAC2025, although LDA new sales exhibit a continued decline. For calendar year 2022, the new vehicle sales counts for LDA have dropped by approximately 230,000 vehicles from the EMFAC2021 prediction.
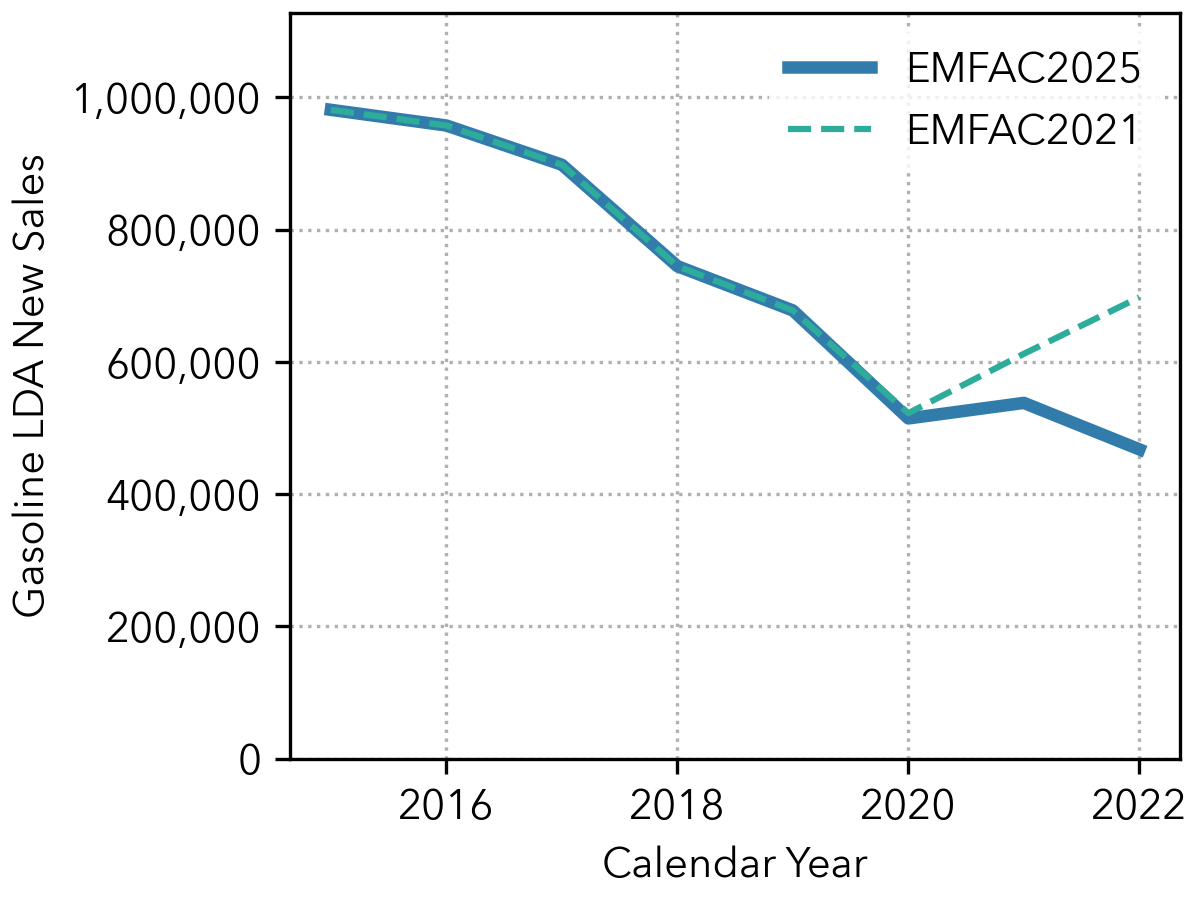
Figure 3.9: Gasoline LDA New Vehicle Sales: EMFAC2025 vs. EMFAC2021#
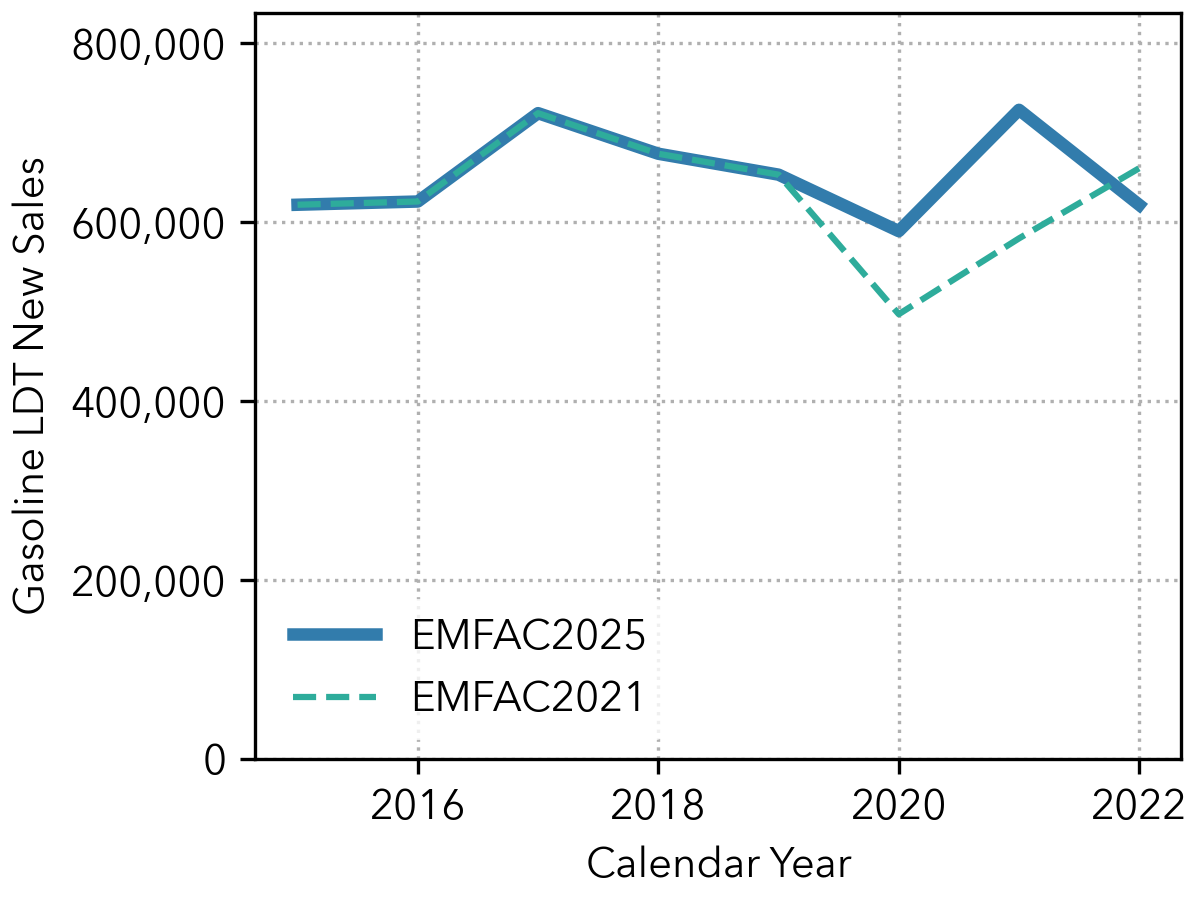
Figure 3.10: Gasoline LDT New Vehicle Sales: EMFAC2025 vs. EMFAC2021#
Figures 3.11 and 3.12 display the diesel light-duty vehicle market sales. Both diesel LDAs and LDTs have experienced significant declines in recent years due in part to emissions irregularities found by CARB and EPA. While EMFAC2021 predicted modest sales increases from 2020 to 2022, EMFAC2025 shows that new LDT sales rebounded in 2020 and 2021 but dropped by more than 40% in the following calendar year 2022. Meanwhile, new diesel LDA sales remain flat in EMFAC2025.
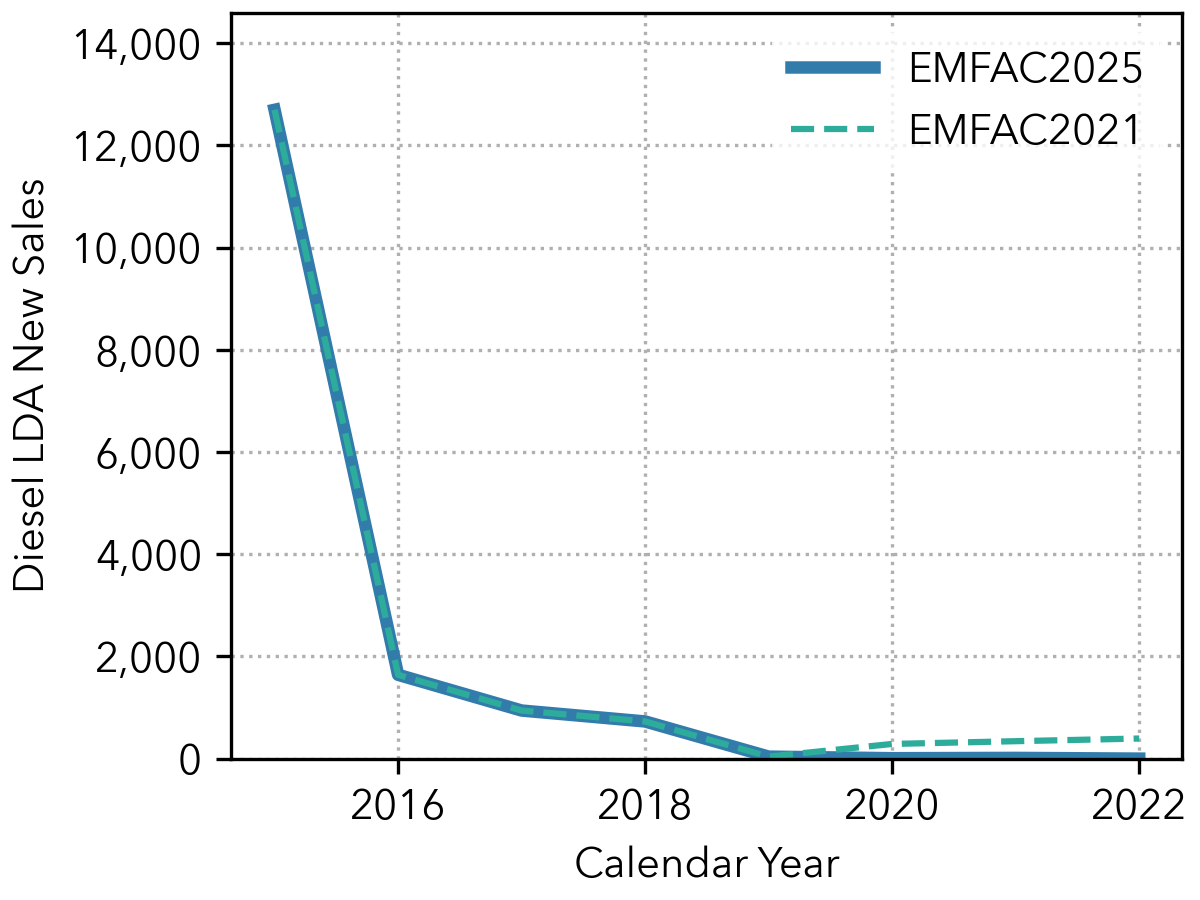
Figure 3.11: Diesel LDA New Vehicle Sales: EMFAC2025 vs. EMFAC2021#
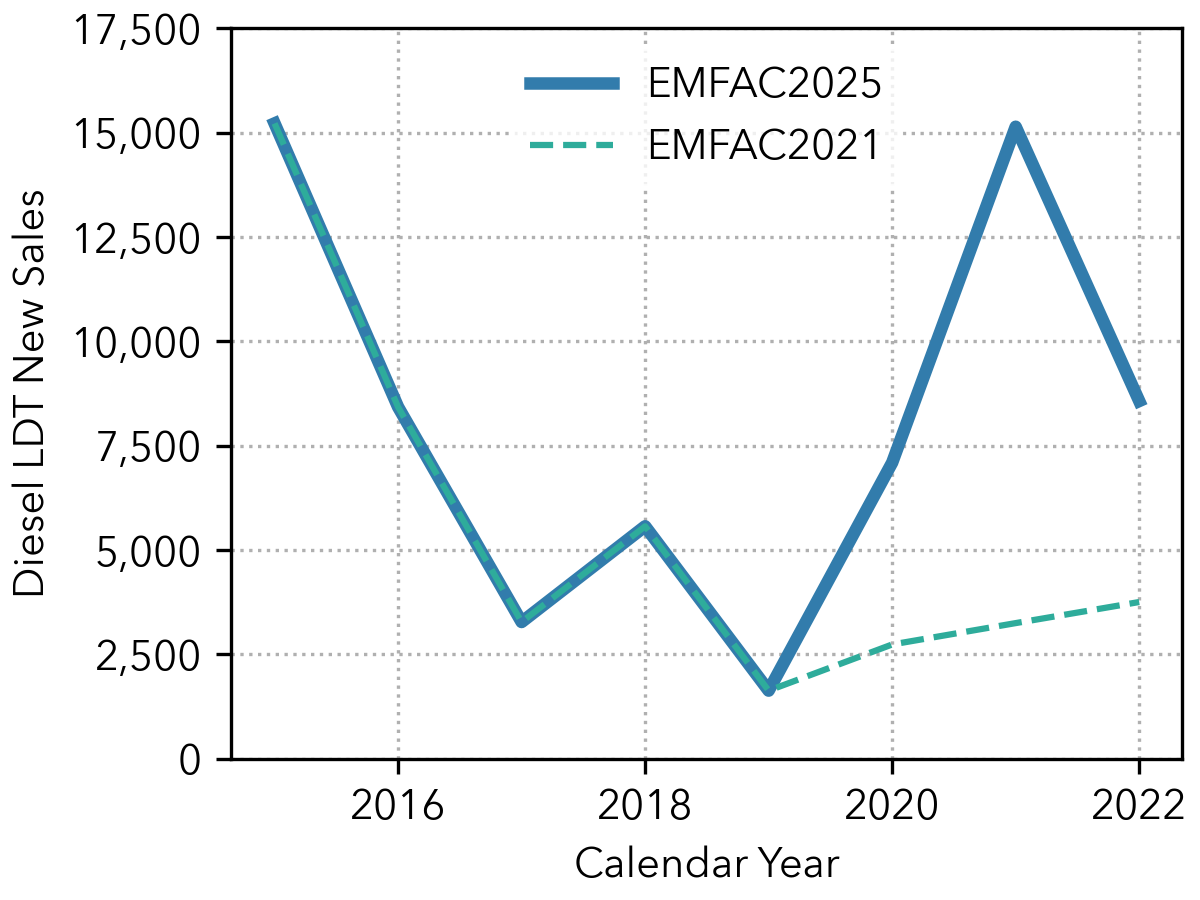
Figure 3.12: Diesel LDT New Vehicle Sales: EMFAC2025 vs. EMFAC2021#
3.1.4. Model Year Distribution#
Figures 3.13 through 3.15 illustrate the distribution of vehicle populations by model year for LDAs, LDTs, and LHDTs in both EMFAC2025 and EMFAC2021. When comparing the base years used in each model, calendar year 2022 for EMFAC2025 and calendar year 2019 for EMFAC2021, a noticeable decline in LDA vehicle counts is observed in EMFAC2025. In contrast, the model year distributions for LDTs and LHDTs follow similar trends in both models, as indicated by the close overlap of the respective lines.
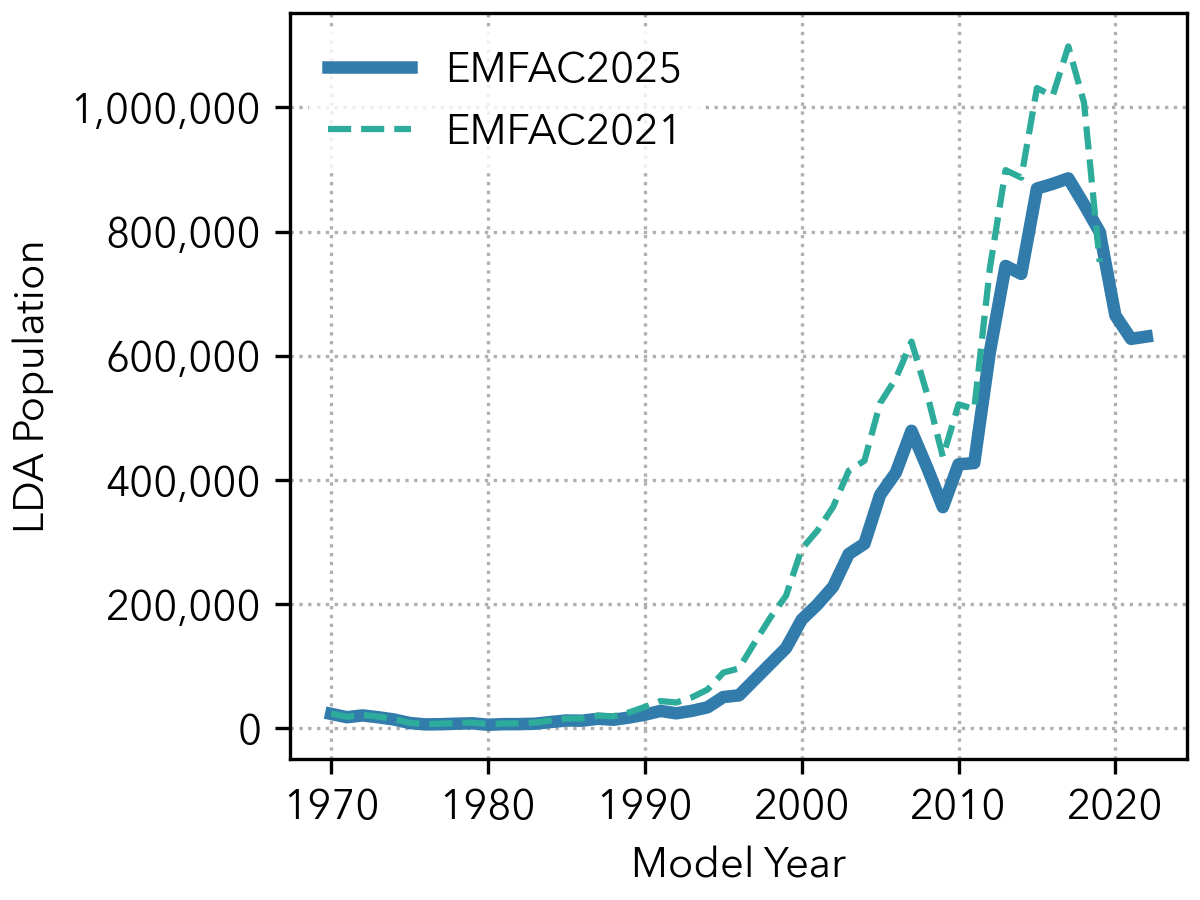
Figure 3.13: LDA Model Year Distribution: EMFAC2025 vs. EMFAC2021#
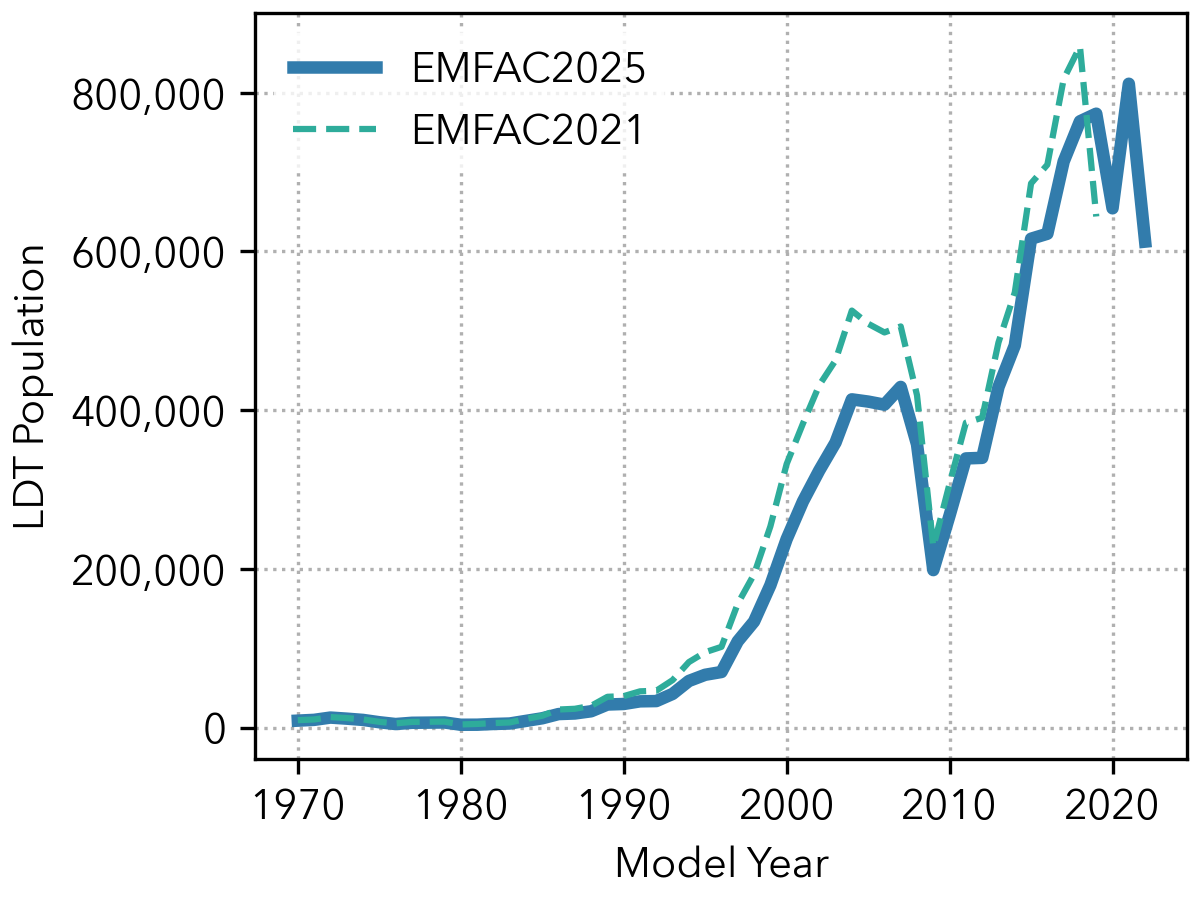
Figure 3.14: LDT Model Year Distribution: EMFAC2025 vs. EMFAC2021#
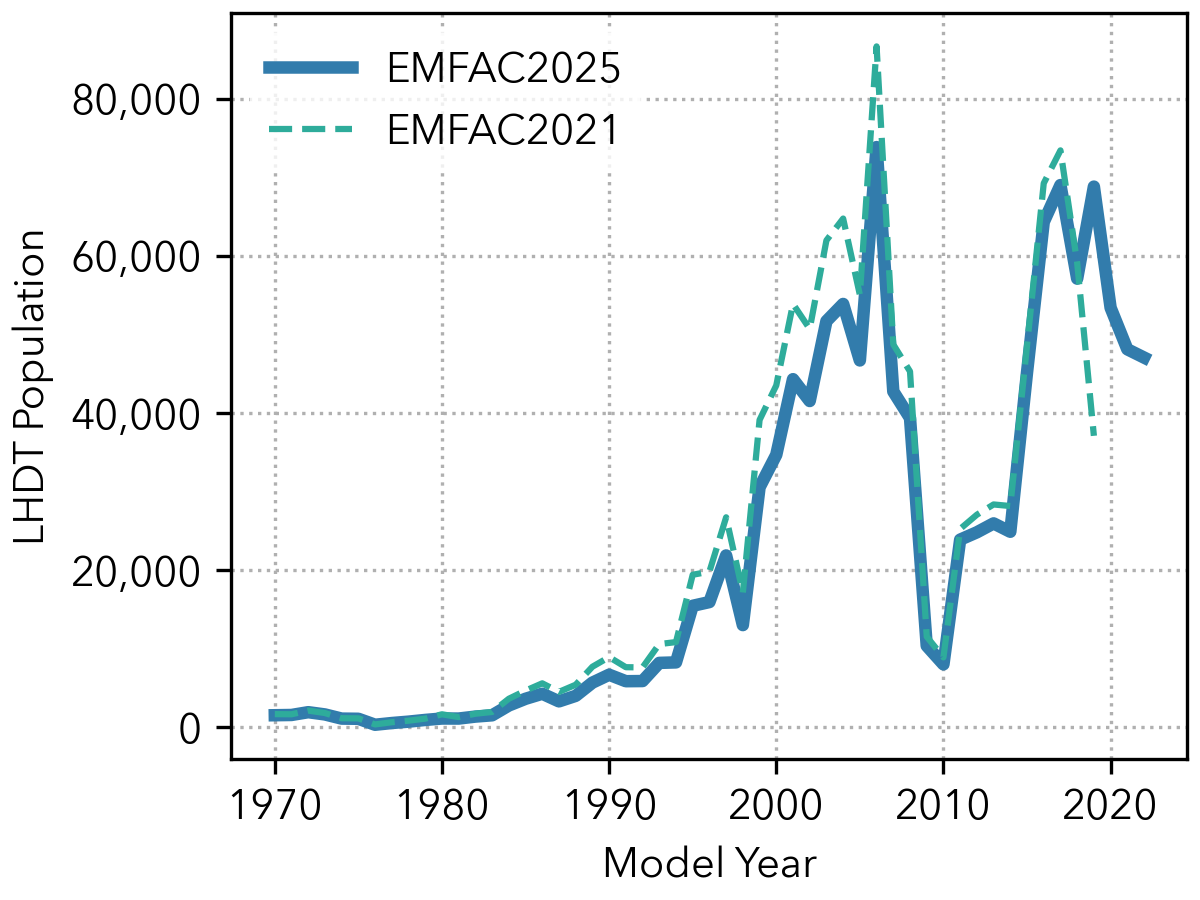
Figure 3.15: LHDT Model Year Distribution: EMFAC2025 vs. EMFAC2021#