4.5. Zero-Emissions Vehicle Regional Allocation#
EMFAC2021 estimates ZEV market share using light-duty vehicle choice models developed by the California Energy Commission (CEC). EMFAC2025 applies an updated version of the same framework, incorporating projections from the CEC’s 2025 Integrated Energy Policy Report (IEPR) (CEC, 2025). The IEPR 2025 projections incorporate updated economic and demographic forecasts, fuel price assumptions, personal and commercial vehicle choice modeling, and current state fleet requirements for California government vehicles. They also reflect the expiration of federal tax incentives for ZEV purchases in September 2025.
CEC has developed and updated the IEPR modeling framework since 2003. It is an important tool for policymaking in California, including projecting demand for alternative fuel vehicles, forecasting future transportation energy consumption, and evaluating policy scenarios. California-specific data from the California Vehicle Survey form the foundation of the framework and are used to derive model coefficients. The survey captures the geographic distribution of households and businesses across California and includes thousands of responses, including hundreds from plug-in electric vehicle owners. ZEV new sales were mapped from IEPR vehicle classes to EMFAC vehicle classes using the ratios presented in Table 4.8.
Another update in EMFAC2025 is the regional reallocation of ZEV new sales. The EMFAC2021 forecast assumed equal ZEV sales shares across all counties; however, historical data from the Department of Motor Vehicles (DMV) indicates significant regional variation in adoption rates. To account for this variation, CARB established a contract with Lawrence Berkeley National Laboratory (Contract No. 22AQP010), titled Spatially Disaggregated Forecasting of ZEV Adoption in California (Jin, 2023). This project developed a vehicle-choice micro-simulator to spatially disaggregate forecast ZEV market shares at the county level, providing more regionally accurate inputs for EMFAC2025.
IEPR Vehicle Type |
EMFAC Vehicle Category |
|||
|---|---|---|---|---|
LDA |
LDT1 |
LDT2 |
MDV |
|
S Car-Midsize |
100% |
0% |
0% |
0% |
S SUV-Large |
19% |
0% |
0% |
81% |
S Pickup-Heavy |
0% |
0% |
0% |
0% |
S Car-Compact |
100% |
0% |
0% |
0% |
P SUV-Midsize |
36% |
0% |
42% |
22% |
S Pickup-Std |
0% |
0% |
46% |
54% |
S SUV-Midsize |
36% |
0% |
42% |
22% |
S SUV-Heavy |
0% |
0% |
0% |
0% |
S Car-Subcompact |
100% |
0% |
0% |
0% |
S Van-Heavy |
0% |
0% |
0% |
0% |
P SUV-Large |
19% |
0% |
0% |
81% |
P Car-Large |
100% |
0% |
0% |
0% |
S SUV-Compact |
22% |
1% |
63% |
14% |
P Car-Subcompact |
100% |
0% |
0% |
0% |
S Pickup-Compact |
0% |
0% |
100% |
0% |
P Car-Compact |
100% |
0% |
0% |
0% |
S Van-Std |
0% |
0% |
0% |
100% |
P SUV-Compact |
22% |
1% |
63% |
14% |
P Car-Midsize |
100% |
0% |
0% |
0% |
S SUV-Subcompact |
100% |
0% |
0% |
0% |
P SUV-Subcompact |
100% |
0% |
0% |
0% |
S Van-Minivan |
0% |
14% |
79% |
7% |
S Car-Large |
100% |
0% |
0% |
0% |
P Pickup-Std |
0% |
0% |
46% |
54% |
S Car-Sport |
100% |
0% |
0% |
0% |
P Car-Sport |
100% |
0% |
0% |
0% |
P Pickup-Heavy |
0% |
0% |
0% |
0% |
P Van-Std |
0% |
0% |
0% |
100% |
4.5.1. Regional Allocation Method#
The conceptual model was developed by Clark et al. (2016). Car ownership typically changes over the household life cycle. Young adults often begin with no vehicle or a single car. As they form households and raise children, car ownership tends to increase to one or two vehicles. In families with older children or multiple drivers, ownership may rise to three or more cars. Later in life, as children leave home and adults enter retirement, car ownership typically declines — often returning to one or no vehicles due to changing health, mobility needs, or financial constraints. This model highlights a typical pattern in car ownership aligned with key household transitions.
Based on this concept, LBNL developed a model named Automobile and Technology Lifecycle-Based Assignment (ATLAS) aiming to simulate this vehicle transaction and technology adoption. The ATLAS model captures vehicle transaction decision process, tracks both new and used vehicle choices, and dynamically co-evolves with socio-demographic (Table 4.9) and spatial context. ATLAS provides insights into distributional effects and key drivers of adoption in both new and used vehicle markets (Jin et al., 2024).
Demographic predictors |
Details |
|---|---|
ZEV momentum |
Past ZEV market shares |
County demographics |
Income; Average household size |
Political ideology |
Democrat vote share |
Vehicle attributes |
Price; Maintenance Cost; MPG; Acceleration; Charging time |
Incentives |
Rebate; Tax credit |
Choice-specific |
Powertrain; Body type |
Infrastructure |
Home charging availability |
Household |
Number of vehicles; Have kids; Household size; Income |
The ATLAS model was customized to support the EMFAC2025 update by providing county-level projections of new vehicle sales market share under the ZEV new sales natural growth prediction. This customized version is referred to as ATLAS-Lite. The model is used to assign new vehicle purchases by powertrain and body type to households in a cross-sectional framework. The ATLAS-Lite framework was developed according to the following steps (Figure 4.16). Table 4.10 presents the ATLAS-Lite model build variables:
Prepare the model input including synthetic population by year, statewide ZEV new sales forecast, and vehicle attributes such as price, fuel efficiency, as well as incentives by year.
Initialize the model by county-level ZEV new sales market share in year 2017 based on DMV registration data.
ATLAS-Lite then models the timestep of vehicle transaction and whether the transactions lead to purchase of new vehicles at the household level (the timestep is every 2 years to mitigate the impact of pandemic, with the year 2020 skipped to represent pandemic effects).
For each vehicle purchase that is modeled to occur in the previous step, ATLAS-Lite models the specific choice of vehicle (e.g., internal combustion engine vehicle or zero-emissions vehicles) in each household.
Household-level vehicle choice outputs are aggregated to county-level ZEV new sales and incorporated into EMFAC2025.
CARB staff used DMV registration data to validate the model results for year 2019, 2021 and 2023. The model was only calibrated using the DMV data at year 2017, after that, each year’s ZEV new sales prediction used the prior year’s model output. Thus, although year 2019, 2021, and 2023 were historical years, they are from model outputs with no calibration. The comparison between the model outputs and DMV new sales market share demonstrates the model’s strong performance, credibility, and robustness (Figure 4.17).
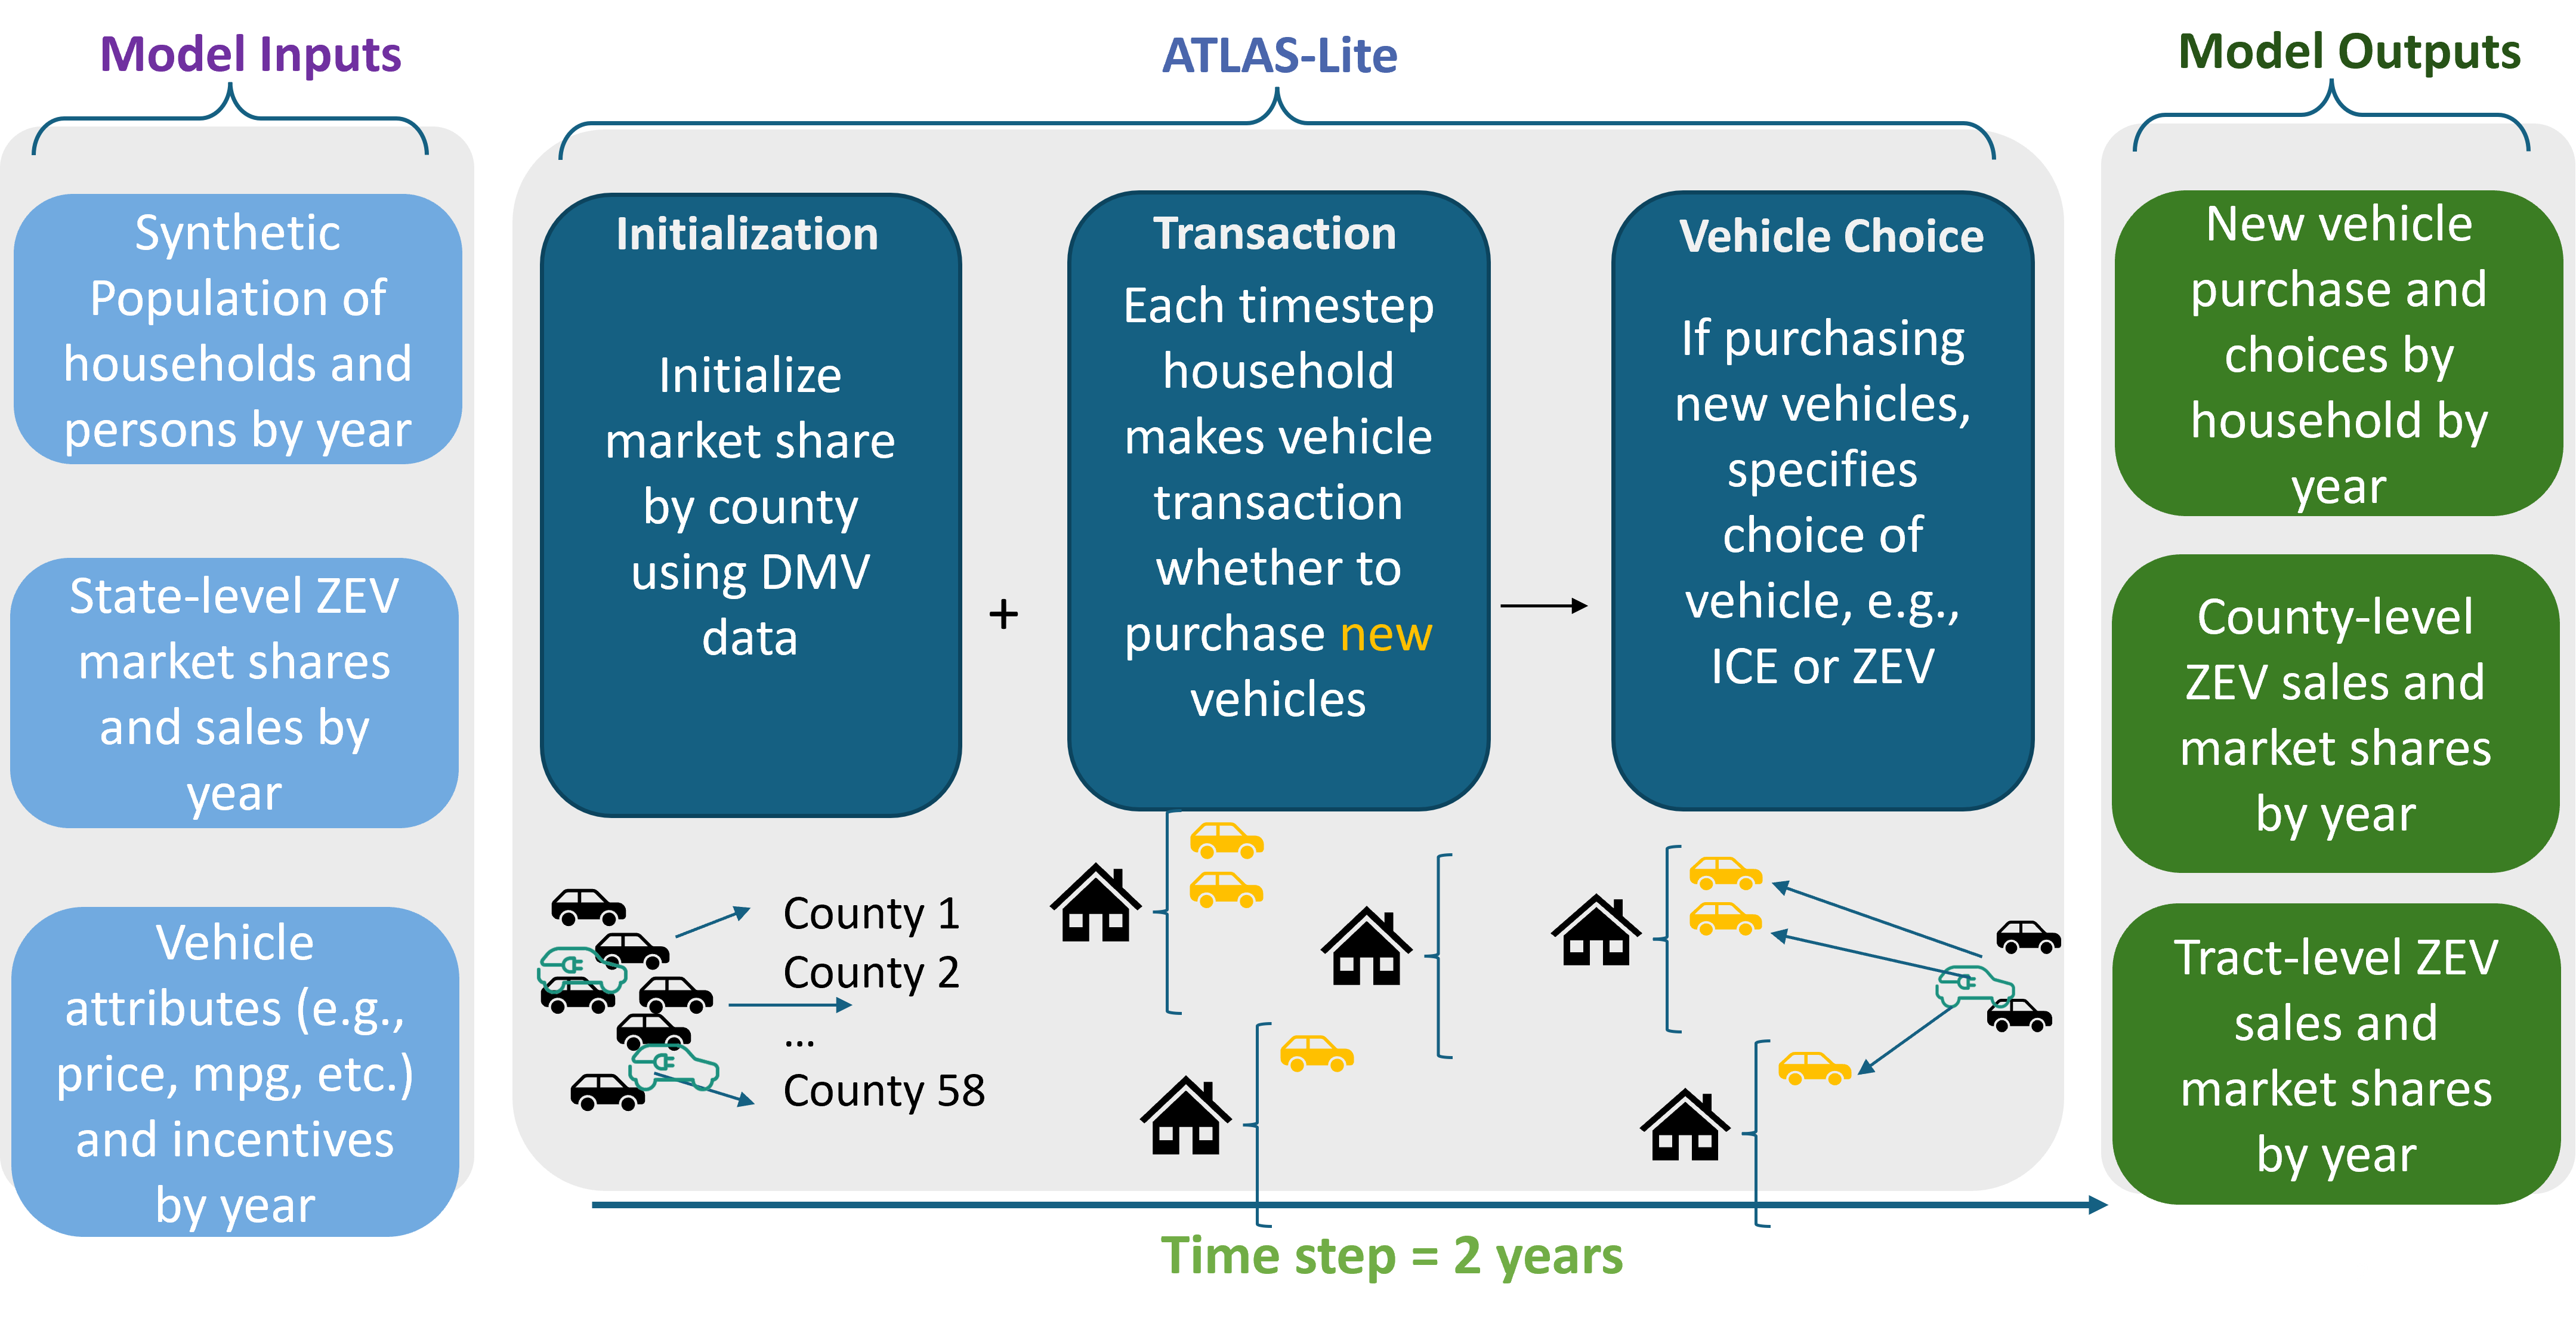
Figure 4.16: Automobile and Technology Lifecycle-Based Assignment-Lite (ATLAS-Lite) Model Framework#
Data Source |
Time Range |
Variables |
Resolution |
|---|---|---|---|
NHTS 2017 California (FHWA, 2018) |
2017 |
Household demographic attributes, Vehicle ownership and choices |
Household |
CEC California Vehicle Survey 2019 (CEC, 2019) |
2019 |
Household demographic choices, Vehicle attribute incentives |
Household |
2016, 2020 |
Democrat vote shares |
County |
|
DMV Registration Data (CARB, 2025) |
2017, 2019, 2021 |
ZEV market shares |
County |
ACS 5-Year (U.S. Census Bureau, 2024) |
2017, 2019, 2022 |
Location context |
Census tract, County |
Transit Access Data (Owen and Murphy, 2018) |
2017 |
Job, Population density, Accessibility transit availability |
Census tract |
CNT Data (CNT, 2019) |
2019 |
Census tract |
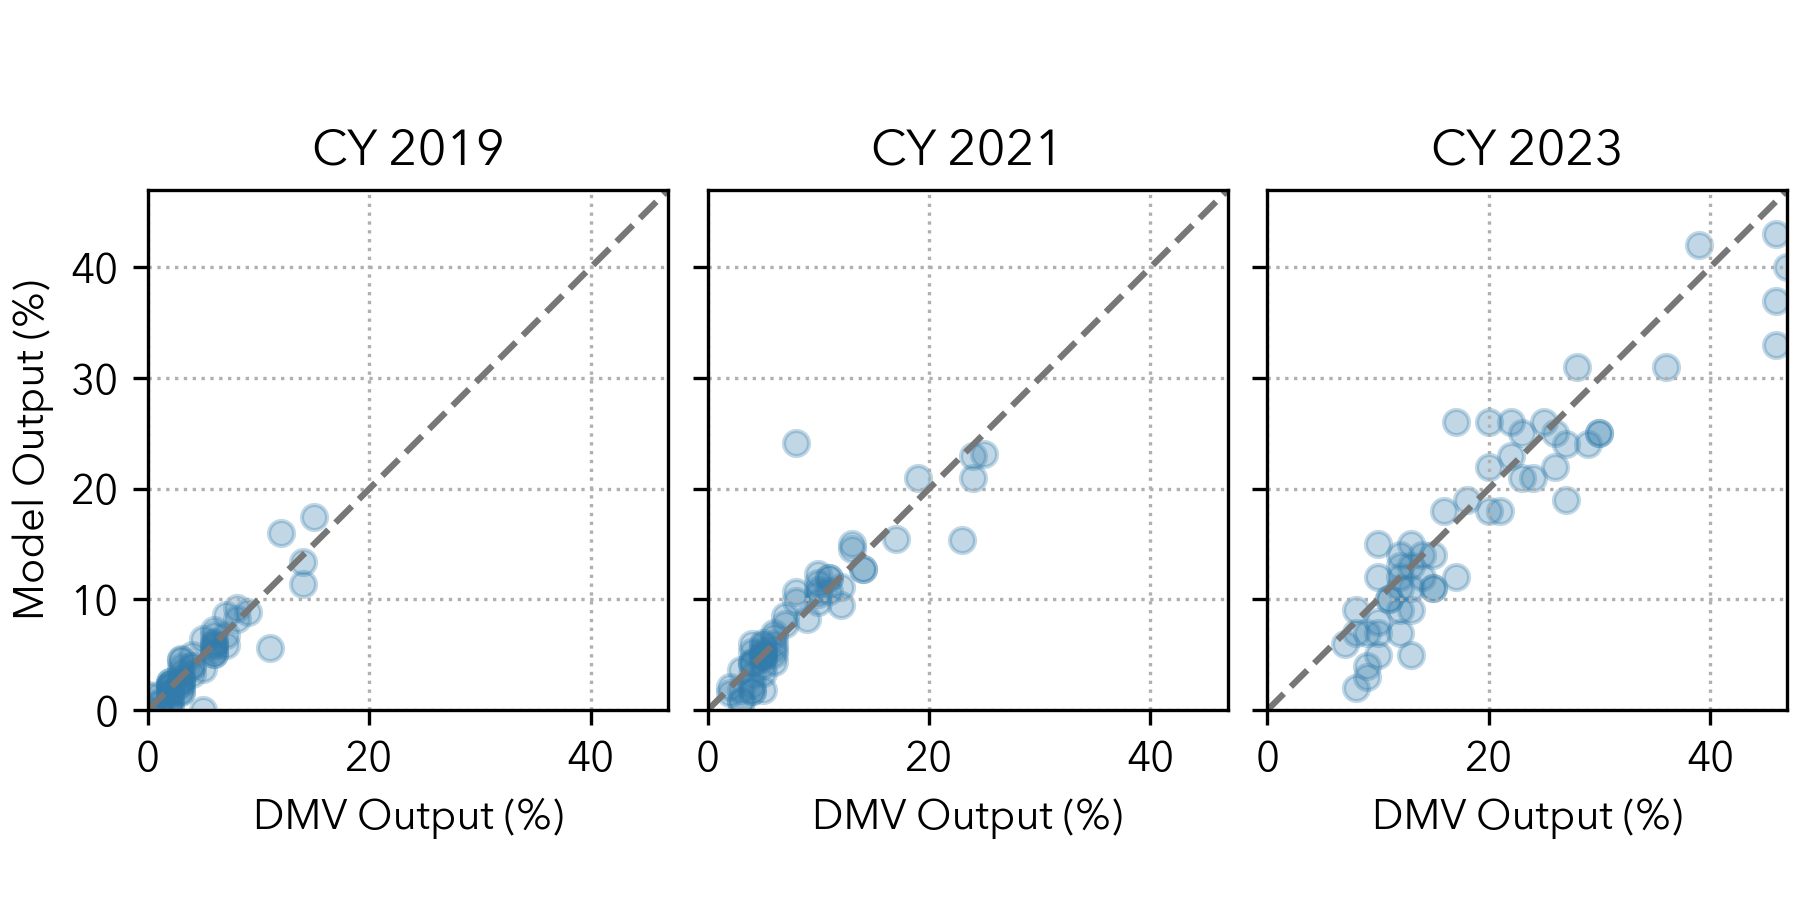
Figure 4.17: Comparison of County-level ZEV New Vehicle Sales between Model Outputs and DMV data#
4.5.2. Regional Allocation Results#
Figure 4.18 displays the projected percentage of light-duty ZEVs among new vehicle sales in each California county for the years 2019, 2035, and 2045. The maps reveal a clear trend in ZEV adoption over time, with notable regional disparities in the early years across counties. The color gradient represents the ZEV share, ranging from 0 (light green) to 100% (dark green).
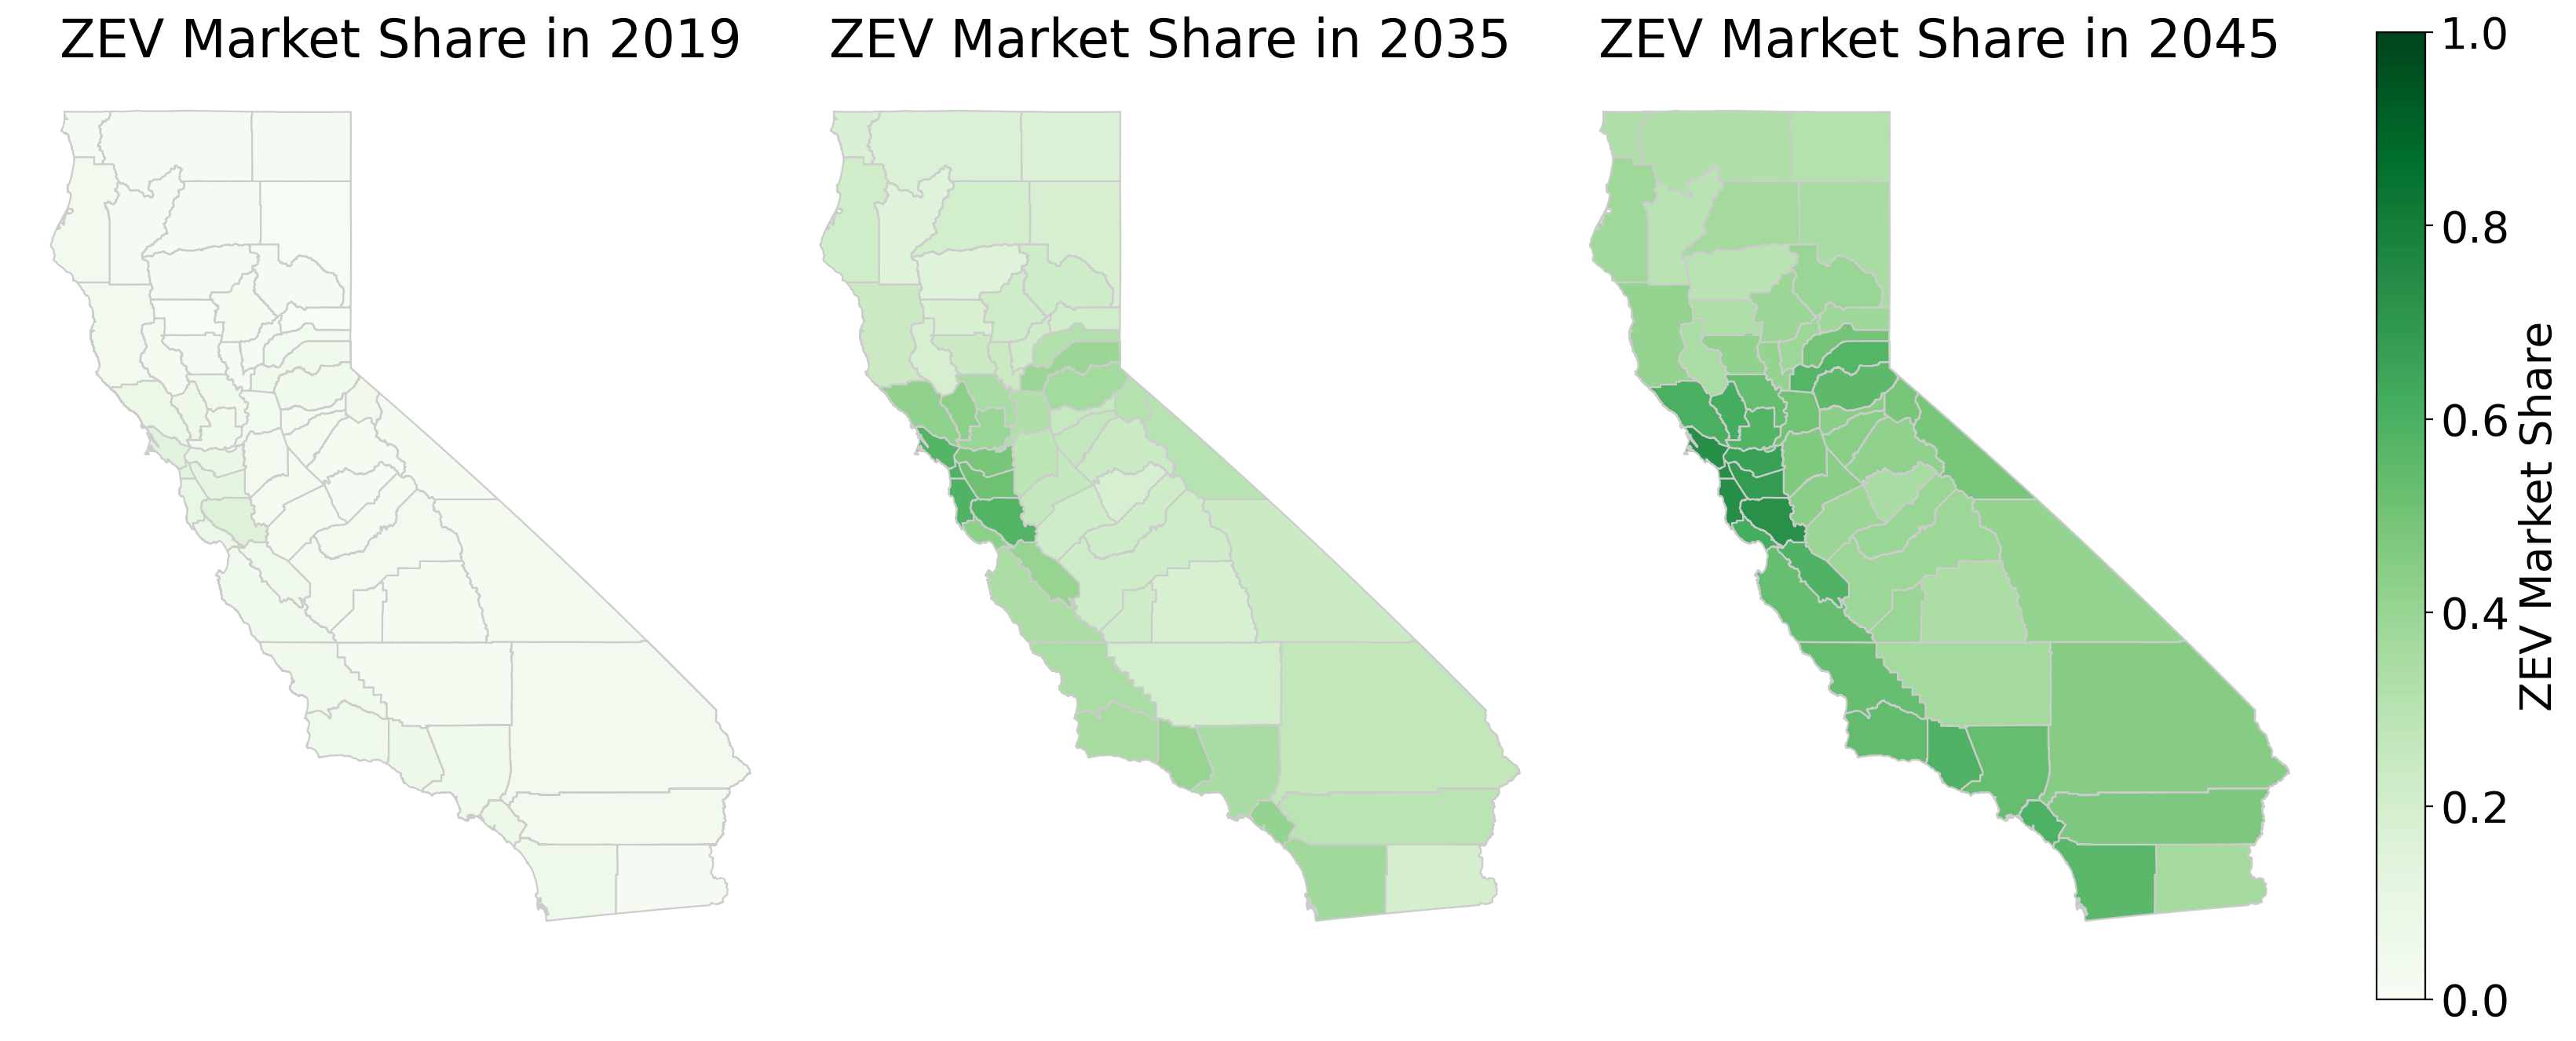
Figure 4.18: Projected County-Level ZEV Share of New Vehicle Sales in 2019, 2035, and 2045#
Figure 4.19 presents the projected growth in ZEV new sales market share for four California counties: Santa Clara, San Francisco, Riverside, and San Bernadino, from 2019 to 2050. Santa Clara and San Francisco show earlier and rapid adoption of ZEV, exceeding 50% ZEV market share by 2027. In contrast, Riverside and San Bernadino exhibit a slower adoption, ultimately reaching above 50% by 2050. The figure highlights regional disparities in ZEV adoption.
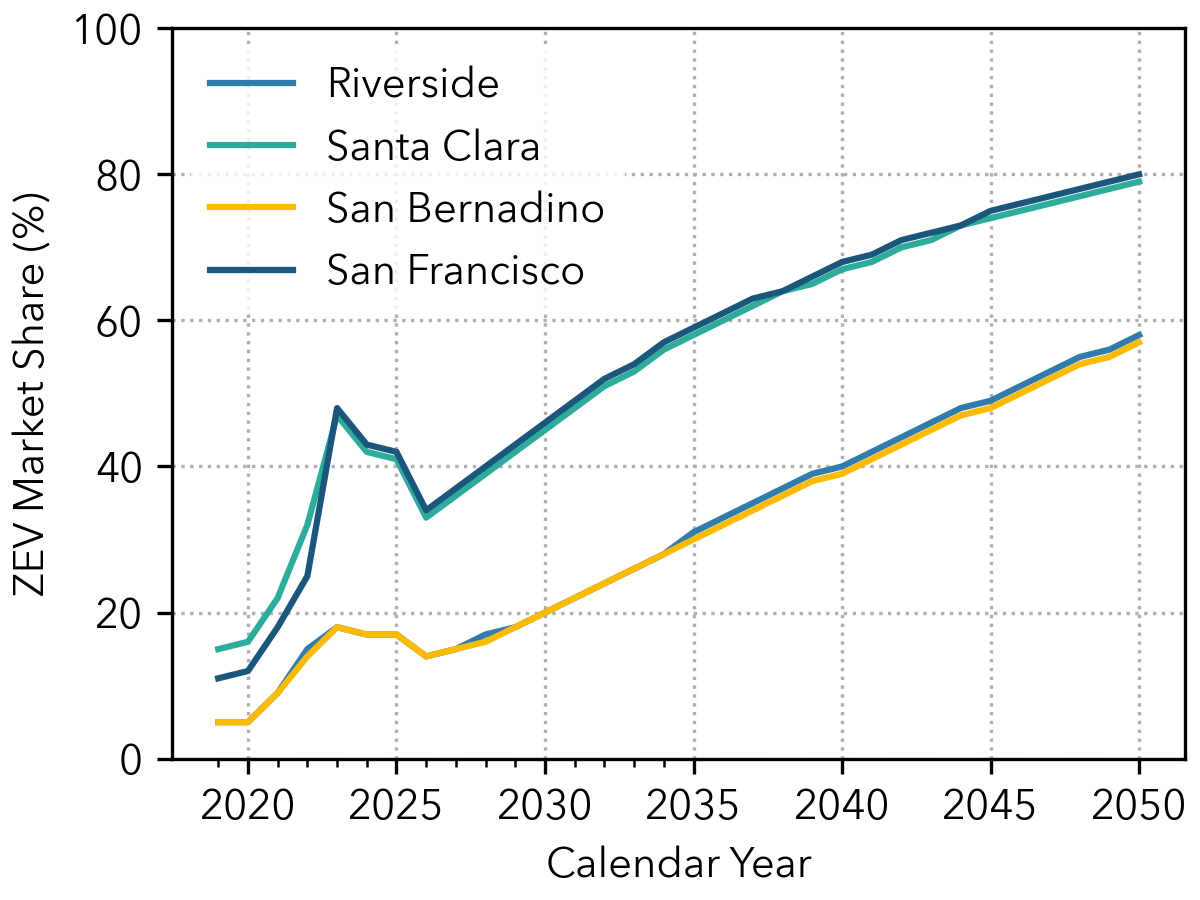
Figure 4.19: Evolution of ZEV New Sale Market Share by County#