8.2. Fuel Cell Electric Vehicles#
8.2.1. Light-Duty Vehicle#
As of 2023, there were 13,369 light-duty fuel cell electric vehicles (FCEV) registered in California. Staff used fuel efficiency information reported by manufacturers through an annual survey cross-referenced with active registrations of each make and model year to estimate hydrogen consumption rates from light-duty FCEVs. The fleetwide average hydrogen consumption rate using data pulled as of April 2023 was 0.0153 kg/mi. Due to lack of data, staff assumed the same hydrogen consumption rate for all speeds.
8.2.2. Heavy-Duty Vehicle#
8.2.2.1. Zero Emission Technology Mix of Heavy-Duty Vehicles#
BEVs and FCEVs are the most common examples of currently available heavy-duty ZEVs. These two types of ZEVs share the goal of eliminating tailpipe emissions but differ in their underlying technologies and operation. BEVs use batteries to store energy from the electrical grid to power electric motors. FCEVs, on the other hand, use hydrogen stored on-board to generate electricity for electric motors.
As of 2022 (EMFAC2025 base year), all heavy-duty ZEVs registered with California’s DMV were BEVs. Given the differing characteristics of battery and fuel cell technologies — both of which are expected to evolve as performance improves and costs decline — it was somewhat challenging to precisely predict which heavy-duty zero-emission technologies fleets would adopt to comply with ZEV requirements. During the Advanced Clean Fleets (ACF) rulemaking (CARB, 2022), based on expected manufacturer product availability and vehicle suitability analyses, heavy-duty fleets were assumed to meet their medium- and heavy-duty ZEV requirements using a combination of BEVs and FCEVs. CARB staff applied these ACF rulemaking assumptions to EMFAC2025 projections. The projected fractions of FCEVs from that analysis are shown in Table 8.2. For most heavy-duty categories, staff assumed that all purchases would be BEVs through 2026. Starting in 2027, purchases were assumed to be 90% BEV and 10% FCEV. However, higher FCEV fractions were assumed for heavy-duty long-haul applications. For example, staff assumed that 46% of T7 NNOOS Class 8 and T7 NOOS Class 8 vehicles would be FCEVs through 2026, increasing slightly to 47.5% thereafter. Additionally, purchases of heavy-duty port trucks and certain tractor categories were assumed to be 10% FCEV through 2026, increasing to 25% from 2027 onward.
Vehicle Categories |
Model Year Range |
|||
|---|---|---|---|---|
2024–2026 |
2027–2050 |
|||
BEV |
FCEV |
BEV |
FCEV |
|
Motor Coach |
1.000 |
0.000 |
0.900 |
0.100 |
OBUS |
1.000 |
0.000 |
0.900 |
0.100 |
PTO |
1.000 |
0.000 |
0.900 |
0.100 |
SBUS |
1.000 |
0.000 |
0.900 |
0.100 |
T6 CAIRP Class 4 |
1.000 |
0.000 |
0.900 |
0.100 |
T6 CAIRP Class 5 |
1.000 |
0.000 |
0.900 |
0.100 |
T6 CAIRP Class 6 |
1.000 |
0.000 |
0.900 |
0.100 |
T6 CAIRP Class 7 |
0.900 |
0.100 |
0.750 |
0.250 |
T6 Instate Delivery Class 4 |
1.000 |
0.000 |
0.900 |
0.100 |
T6 Instate Delivery Class 5 |
1.000 |
0.000 |
0.900 |
0.100 |
T6 Instate Delivery Class 6 |
1.000 |
0.000 |
0.900 |
0.100 |
T6 Instate Delivery Class 7 |
1.000 |
0.000 |
0.900 |
0.100 |
T6 Instate Other Class 4 |
1.000 |
0.000 |
0.900 |
0.100 |
T6 Instate Other Class 5 |
1.000 |
0.000 |
0.900 |
0.100 |
T6 Instate Other Class 6 |
1.000 |
0.000 |
0.900 |
0.100 |
T6 Instate Other Class 7 |
1.000 |
0.000 |
0.900 |
0.100 |
T6 Instate Tractor Class 6 |
1.000 |
0.000 |
0.900 |
0.100 |
T6 Instate Tractor Class 7 |
0.900 |
0.100 |
0.750 |
0.250 |
T6 OOS Class 4 |
1.000 |
0.000 |
0.900 |
0.100 |
T6 OOS Class 5 |
1.000 |
0.000 |
0.900 |
0.100 |
T6 OOS Class 6 |
1.000 |
0.000 |
0.900 |
0.100 |
T6 OOS Class 7 |
0.900 |
0.100 |
0.750 |
0.250 |
T6 Public Class 4 |
1.000 |
0.000 |
0.900 |
0.100 |
T6 Public Class 5 |
1.000 |
0.000 |
0.900 |
0.100 |
T6 Public Class 6 |
1.000 |
0.000 |
0.900 |
0.100 |
T6 Public Class 7 |
1.000 |
0.000 |
0.900 |
0.100 |
T6 Utility Class 5 |
1.000 |
0.000 |
0.900 |
0.100 |
T6 Utility Class 6 |
1.000 |
0.000 |
0.900 |
0.100 |
T6 Utility Class 7 |
1.000 |
0.000 |
0.900 |
0.100 |
T6TS |
1.000 |
0.000 |
0.900 |
0.100 |
T7 CAIRP Class 8 |
0.620 |
0.380 |
0.575 |
0.425 |
T7 NNOOS Class 8 |
0.540 |
0.460 |
0.525 |
0.475 |
T7 NOOS Class 8 |
0.540 |
0.460 |
0.525 |
0.475 |
T7 Other Port Class 8 |
0.900 |
0.100 |
0.750 |
0.250 |
T7 POAK Class 8 |
0.900 |
0.100 |
0.750 |
0.250 |
T7 POLA Class 8 |
0.900 |
0.100 |
0.750 |
0.250 |
T7 Public Class 8 |
1.000 |
0.000 |
0.900 |
0.100 |
T7 Single Dump Class 8 |
1.000 |
0.000 |
0.900 |
0.100 |
T7 Single Concrete/Transit Mix Class 8 |
1.000 |
0.000 |
0.900 |
0.100 |
T7 Single Other Class 8 |
1.000 |
0.000 |
0.900 |
0.100 |
T7 SWCV Class 8 |
1.000 |
0.000 |
0.900 |
0.100 |
T7 Tractor Class 8 |
0.892 |
0.108 |
0.745 |
0.255 |
T7 Utility Class 8 |
1.000 |
0.000 |
0.900 |
0.100 |
T7IS |
1.000 |
0.000 |
0.900 |
0.100 |
UBUS |
1.000 |
0.000 |
0.900 |
0.100 |
8.2.2.2. Data Source for Hydrogen Consumption Rate#
Hydrogen (H2) consumption rates of heavy-duty vehicle categories were collected from two CARB-funded projects: (1) The SunLine Fuel Cell Buses & Hydrogen Onsite Generation Fueling Station Pilot Commercial Deployment Project (hereafter referred to as the SunLine Project) (SunLine, 2022), and (2) The Port of Los Angeles Zero- and Near-Zero-Emission Freight Facilities “Shore to Store” Project (hereafter referred to as the Shore to Store Project) (Goldberg et al., 2023).
The SunLine Project was a four-year project that deployed five new 40-foot fuel cell electric transit buses in daily service in the Coachella Valley and included an upgrade to SunLine’s existing hydrogen refueling station. Operating data for the buses and stations were collected and analyzed for one year. The buses cumulatively traveled over 150,000 miles and consumed over 22,000 kg of on-site produced hydrogen.
The Shore to Store project was designed to develop and demonstrate the technical feasibility of advanced zero-emission technologies and supporting infrastructure in goods movement operation. In this project, ten Class 8 fuel cell electric trucks conducted drayage operations across four different fleet operators (UPS, TTSI, SCE, and TLS). The demonstration fleet fueled at the ‘Shore to Store’ hydrogen fueling stations that were installed in Ontario, California and Wilmington, California. From the 10 Class 8 FCEV trucks, nearly 22,000 miles of in-service miles and over 59,000 total miles of operational data were collected over 13 months.
CARB staff used collected data on hydrogen consumption rates across different vehicle speed ranges to develop speed-specific H2 consumption rates for the UBUS and HHDT categories, as shown in Figure 8.4. These speed-specific rates were then scaled to the remaining lighter heavy-duty vehicle categories using the ratio of each category’s electric energy consumption rate to that of HHDT (or UBUS). The electric energy consumption rates used in this scaling are provided in Table 8.3.
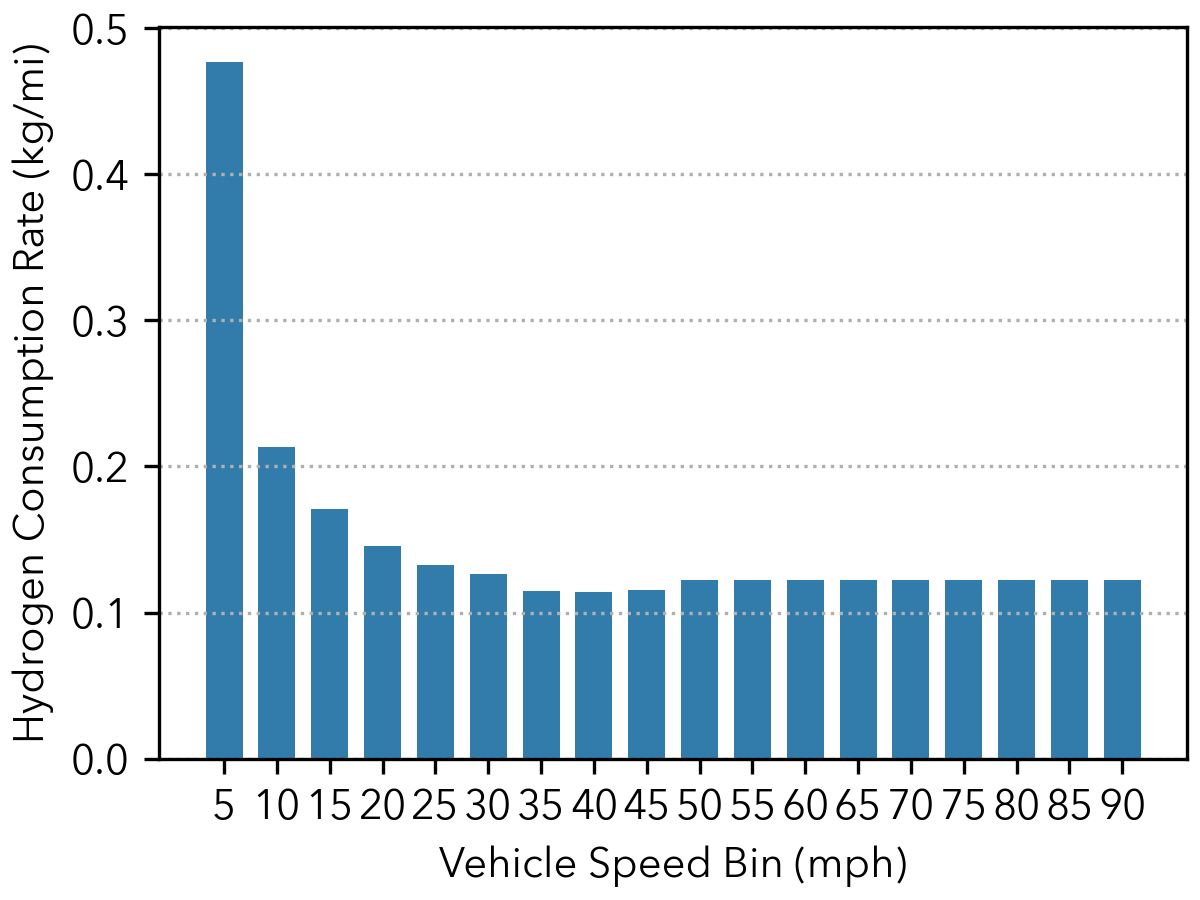
Figure 8.4: Speed-Specific Hydrogen Consumption Rates of Heavy Heavy-Duty Trucks (HHDT) and Transit Bus (UBUS) Categories#
EMFAC2007 Heavy-Duty Vehicle Categories |
Electricity Consumption (kWh/mi) |
|---|---|
Heavy Heavy-Duty Trucks (HHDT) |
2.07 |
Light Heavy-Duty Trucks 8,501–10,000 lbs. (LHDT1) |
0.66 |
Light Heavy-Duty Trucks 10,001–14,000 lbs. (LHDT2) |
0.66 |
Medium Heavy-Duty Trucks (MHDT) |
1.46 |
Other Buses (OBUS) |
1.46 |
School Buses (SBUS) |
1.46 |
Urban Buses (UBUS) |
2.07 |